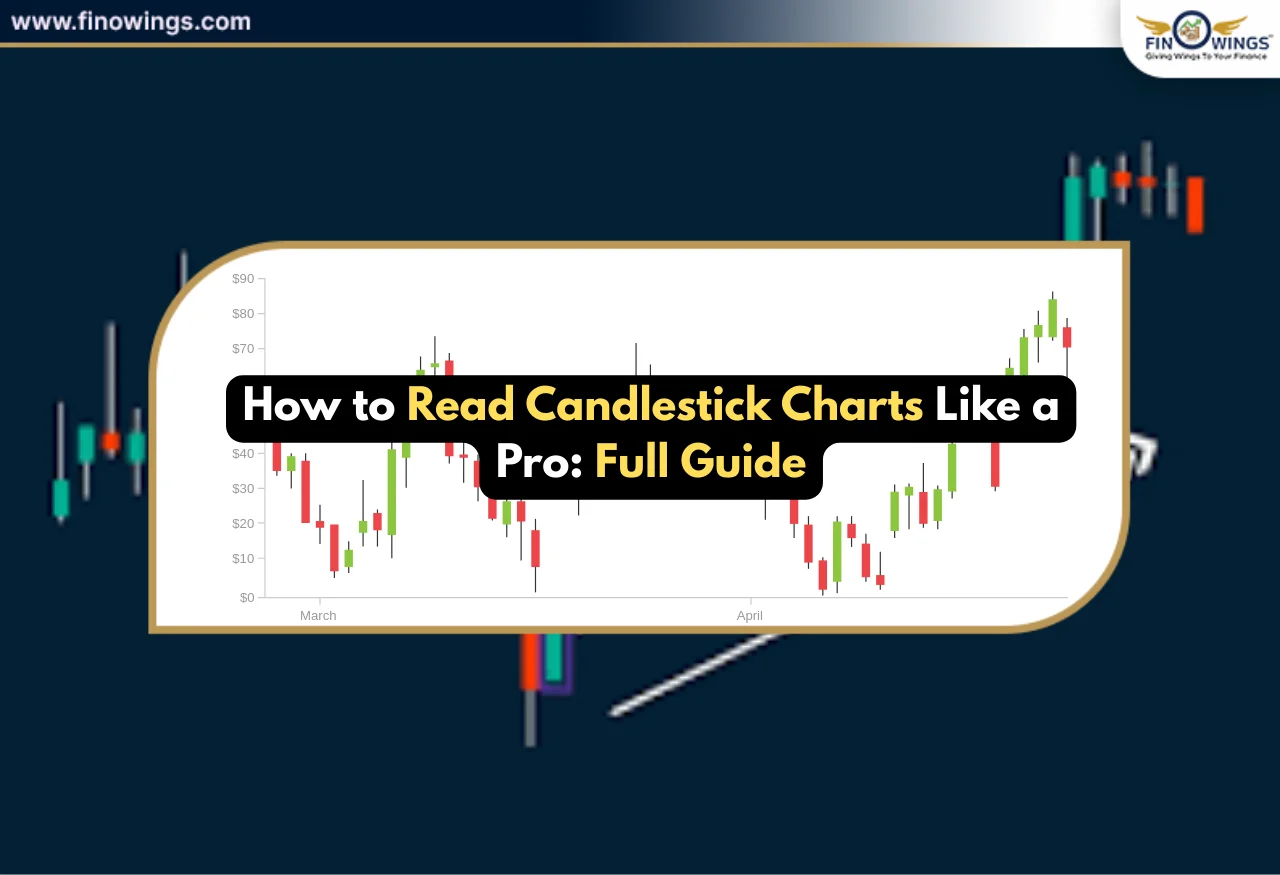
In technical analysis, learning candlestick charts is essential. You will have more success if you know how to correctly analyze price changes in your preferred market (stocks, cryptocurrency, FX, or commodities).
This guide will teach you how to read market psychology from candlesticks, how to spot market psychology signals, and develop a solid trading strategy from them. If you're a beginner hoping to learn to read price action and candlestick patterns, you've come to the right place. Stock charts will be read easily after going through this detailed guide.
What Does A Candlestick Represent?
Every candlestick is the story of a struggle between the buyers and the sellers. In order to understand candlesticks, you need to know what every component stands for.
Open - The price at which the candle opened.
Close - The price at which the candle finished.
High - The highest price buyers were willing to pay.
Low - The lowest price sellers were willing to sell at.
This is the important part:
A candle is not just some shape, but the psychology of the market.
A green (bullish) candle means that buyers won the battle, whereas a red (bearish) candle means that sellers won the battle.
Emotions establish the groundwork for market analysis.

How to Analyze the Candlestick Body
The body of the candle explains the degree of the momentum:
1. Long Body = Strong Momentum
Long green – strong buyers present in the market.
Long red – strong sellers present in the market.
2. Small Body = Weak Momentum or Indecision The market shows signs of:
-
Consolidation
-
A trend isn’t clear.
-
A bullish or bearish reversal could be present.
How to Use This in Trading
In an uptrend – large green candle bodies suggest the momentum is bullish.
In a downtrend – large red candle bodies suggest the downtrend is strong.
At price – support/resistance small candle bodies indicate the market is hesitating.
How to Read the Wicks (Shadows)
The general public price action ignores the wicks. This is a mistake as Wicks are one of the most important parts of the price action.
Wicks show rejection, traps and hidden pressure.
Long Upper Wick
A lot of bullish buyers’ momentum went into the market, and price shot up, however sellers firmly rejected the price at a certain high price point, and sellers are in control.
Bearish pressure
-
Market is approaching a consolidation level (resistance).
-
Warning sign of a trend reversal.
Long Lower Wick
Sellers had momentum in the market, and they pushed price down. Buyers, however, had a lot of pressure as they sucked the price up.
Bullish pressure.
-
Market is approaching a consolidation level (support).
-
Warning sign of a trend reversal.
Small/No Wicks.
-
Striking Conviction.
-
Trending Follow-Through.
How to Read Candlesticks in Context.
Novice traders analyse single candles. Experts analyse multiple candles. An isolated candle means nothing without analysing:
- The trend's direction
- The candle's size
- Candle's position (support/resistance)
- Volume
- Previous candles
Step-by-Step: How to Read Candlestick Charts Like a Pro
Step 1: Identify the Trend
Before analysing any candles, ask:
- Is the price rising overall? (Uptrend)
- Is the price falling? (Downtrend)
- Is the price moving sideways? (Range-bound)
This sets the basis for your entire analysis.
Example:
A bullish candle during an uptrend is bullish continuation.
A bullish candle during a downtrend is just a pullback.
Step 2: Read the Strength of Buyers and Sellers
Ask 3 questions:
Who is in control?
Green (bulls) or red (bears)?
How strong is their control?
Look at the size of the body.
Is control weakening?
Look at the size of the bodies. This is crucial for reading charts and analysing the market.
Step 3: Identify Rejections and Traps Using Wicks
Long upper wick → selling pressure.
Long lower wick → buying pressure.
Wick on both sides → ambiguous market.
You will find:
-
Fake outs.
-
False moves.
-
Liquidity traps.
-
Real trend changes.
Step 4: Read Candles at Important Levels
Candles also become ineffective when standalone without levels:
-
Support.
-
Resistance.
-
Supply zones.
-
Demand zones.
-
Trendline touches.
-
Breakout areas.
Example:
When touching resistance:
-
Long upper wick = bearish rejection
-
Small body = indecision
-
Bearish follow-up = confirmation to enter short.
-
This is the way that professionals create a trading plan involving candlesticks.
Step 5: Look at Current Candles Compared to Previous Candles
Professional traders focus on:
-
Size of the candle.
-
Momentum.
-
Wick activity.
-
Volume.
-
Strength of trend.
Example:
If smaller candles keep appearing in an uptrend → it shows that buying pressure is weakening → trend reversal is likely.
Step 6: Look for Signals in Volume
-
Volume confirms the signal.
-
Big candlestick + lots of volume = bullish signal
-
Big candlestick + low volume = bullish trap
-
Small candlestick + lots of volume = struggle for control between bulls and bears
-
Volume should be combined with candlestick patterns for the best results.
-
Building a Strategy with Candlestick Patterns
-
This is an effective and easy-to-use price action-based trading strategy we've got for you.
Bullish Setup: How to Read
-
The price reaches the support level.
-
A candle prints a long lower wick.
-
The candle closes above the previous candle.
-
The volume increases.
-
The price continues upward.
-
Enter a long position with a stop loss placed below the wick.
Bearish Setup: How to Read
-
The price reaches the resistance level.
-
A candle has a long upper wick.
-
The next candle closes as a red candle.
-
The move is confirmed with volume.
-
Enter a sell position with a stop loss above the wick.
Common Mistakes to Avoid
-
Reading candles by themselves without the context of the trend.
-
Entering a position after one single candle.
-
Ignoring volume.
-
Not marking out key price levels.
-
Blindly trading every pattern.
-
Overcomplicating chart patterns.
To be able to read candles like a pro (or at least close to it), a combination of the following is needed:
Candles + context + volume + levels = smart trading.

Final Thoughts
Learning to read candlestick charts is one of the most important things you can do in order to become a professional trader. Knowing how to identify and distinguish candle bodies and wicks, candle structure, trends and wick rejection zones self-upgrades the clarity of your market analysis and the sharpness of your trading decisions.
Candlestick charts in order to build a solid trading strategy is your most useful money-making skill in the market, combined with price action, trading will be simplified and you will have unrivalled efficiency, especially for beginner traders.

DISCLAIMER: This blog is NOT any buy or sell recommendation. No investment or trading advice is given. The content is purely for educational and information purposes only. Always consult your eligible financial advisor for investment-related decisions.