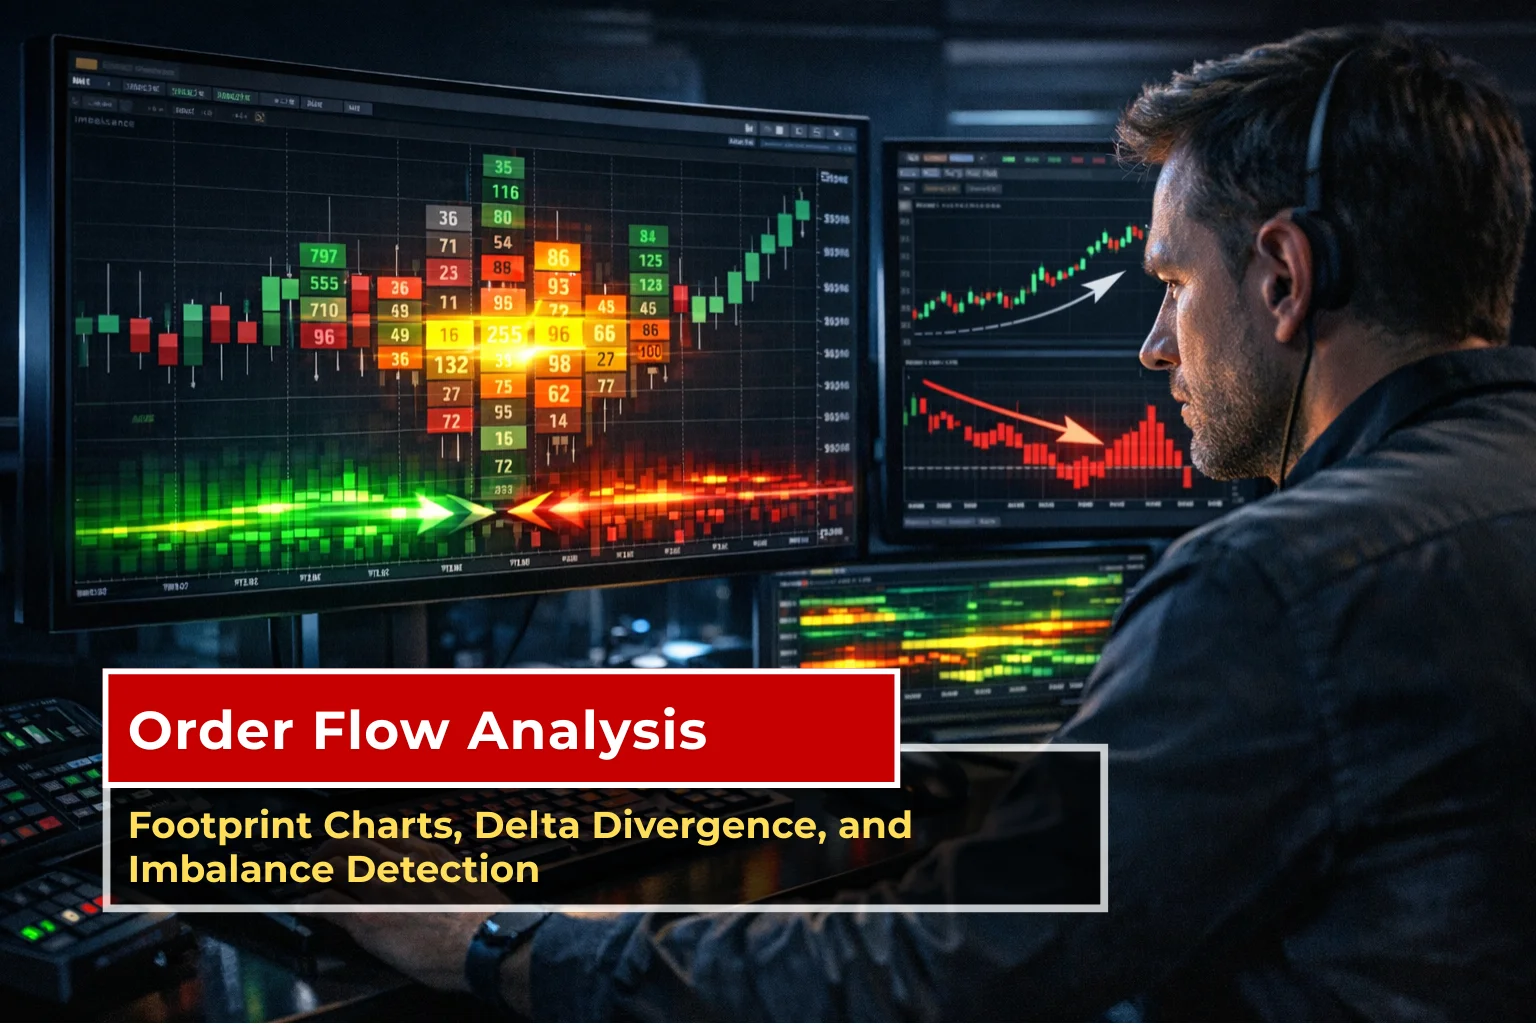
Imagine staring at your trading screen as a stock or index climbs higher on a clean candlestick chart. You enter a long position feeling confident. Suddenly, the price reverses sharply, and you’re left wondering what went wrong. The chart looked perfect on the surface.
Most beginners only see the final price movement. But every candle hides a real battle between buyers and sellers, placing actual orders. Order flow trading gives you a way to look inside that battle. It shows who is aggressively buying or selling in real time, helping you understand the true strength behind price moves.
This beginner-friendly guide explains order flow analysis in plain, simple language. You’ll learn how footprint charts work, what delta divergence means, how stacked imbalances create trading opportunities, and practical order flow signals you can use.
We’ll walk through a complete step-by-step setup, real examples, risk rules, and common mistakes. By the end, you’ll have a clear process for reading order flow and combining it with basic price action for better decisions.

Understanding the Foundations: Bid vs Ask and Market vs Limit Orders
Every trade involves a buyer and a seller. The bid is the highest price buyers are ready to pay right now. The ask is the lowest price sellers are willing to accept.
When traders use market orders, they buy or sell immediately at the current price. This is an aggressive flow that can push the price quickly. Limit orders wait at a specific price. These are passive and often provide support or resistance.
Order flow trading focuses mainly on aggressive market orders. It reveals whether buyers are lifting the ask (pushing price up) or sellers are hitting the bid (pushing price down). This hidden information helps you spot when a move has real conviction or is likely to fade.
Footprint Charts: Your Window Inside Every Candle
Standard candlesticks show only open, high, low, and close. A footprint chart (sometimes called a cluster or volume footprint) breaks each candle into individual price levels and displays the exact volume traded at each one, split between buying and selling activity.
Typically:
- The left side shows selling volume (aggressive hits on the bid).
- The right side shows buying volume (aggressive lifts on the ask).
Big numbers or highlighted areas show where the heaviest trading happened. Footprint charts help you identify volume clusters that often act as future support or resistance.
A basic way to start: Look for price levels inside the candle where one side shows much higher volume.
This can signal absorption (one side quietly taking the other’s orders) or exhaustion (the driving side is running out of steam). Many beginners find footprint charts easier to read than raw numbers once they get used to the layout.
Delta and Cumulative Delta: Measuring Buying vs Selling Pressure
Delta is straightforward: it’s buying volume minus selling volume for a specific period (one candle or a group of candles). Positive delta means buyers were more aggressive. Negative means sellers dominated.
The cumulative delta adds this up over time, like a running scoreboard for the session. A steadily rising cumulative delta line during an upmove confirms healthy buying pressure.
Delta divergence occurs when price and delta tell different stories. For example:
- Price makes a new high, but delta is flat or turning negative → buyers may be losing strength, hinting at a possible reversal.
- Price makes a new low, but delta starts rising → hidden buying interest could lead to a bounce.
These delta signals often appear before the crowd notices a shift and work well when combined with footprint patterns.
Imbalances, Stacked Imbalances, and Absorption vs Exhaustion
Markets move when one side clearly dominates. An imbalance appears on a footprint chart when buying volume at a price level is significantly higher than selling (often 3:1 or more), or the reverse.
Stacked imbalances mean several of these strong levels appear one after another in the same direction. They frequently act as support (for buying stacks) or resistance (for selling stacks) because aggressive traders tend to defend or re-enter at those zones.
Two important related concepts:
- Absorption: Large volume hits a level but the price barely moves. It suggests passive limit orders are soaking up the aggressive flow — often a sign of potential reversal.
- Exhaustion: Volume spikes at a new high or low, but follow-through fades quickly. No one is left to keep pushing in the same direction.
Spotting these patterns helps you understand whether a move is likely to continue or stall.

A Practical Step-by-Step Order Flow Trading Setup
Here’s a repeatable process many beginners follow for order flow setups:
- Choose liquid markets: Start with Nifty or Bank Nifty futures, major stocks, or popular index futures where volume data is clear and reliable.
- Select timeframe: Use 5-minute or 15-minute charts for day trading to keep things manageable.
- Identify key levels: Look near previous highs/lows, round numbers, or volume profile value areas.
- Check footprint and delta: Wait for stacked buy imbalances or absorption near support, plus positive delta or bullish divergence.
- Entry trigger: Price starts moving in the expected direction with confirming order flow (for example, continued positive delta).
- Stop-loss placement: Put it just beyond the imbalance zone or absorption area — typically risking 0.5–1% of your account.
- Target and management: Aim for at least 1:2 risk-reward. Trail stops using cumulative delta or scales out half at the first target. Exit if delta flips strongly against your position or the imbalance disappears.
Always practice this on a demo account first. Focus on high-probability setups rather than forcing trades.
To understand delta signals more deeply, it also helps to learn how option Greeks like delta, gamma, theta, and vega impact price movement. You can explore this in our detailed guide on Learn Options Greeks in Simple Language: Delta, Gamma, Theta, Vega.
Real-World Example with Data Table
Here’s a simplified snapshot of what a footprint might show during a support test on a 5-minute futures candle:
|
Price Level |
Buy Volume (Ask Lifted) |
Sell Volume (Bid Hit) |
Delta |
Observation |
|
24,460 |
980 |
240 |
+740 |
Strong buy imbalance |
|
24,450 |
1,150 |
310 |
+840 |
Stacked by an imbalance forming |
|
24,440 |
720 |
650 |
+70 |
Minor selling pressure |
|
24,430 |
1,380 |
190 |
+1,190 |
Clear absorption by buyers |
In this case, the price dipped toward 24,430 but buyers absorbed the selling aggressively, keeping the delta positive. A trader might enter long with a stop below the zone, targeting the next resistance cluster. This kind of setup combines footprint patterns with delta confirmation for clearer decisions.
Best Platforms for Order Flow Trading in 2026
You need software that supports footprint charts and delta tools. Here’s a practical comparison based on current trader feedback:
|
Platform |
Key Strengths |
Footprint & Delta Support |
Best For |
Approx. Cost (2026) |
Beginner Notes |
|
NinjaTrader |
Popular community, execution tools |
Strong with add-ons |
Futures day traders |
Free platform + data fees |
Good starting point |
|
Sierra Chart |
Highly customizable, low-latency |
Excellent |
Advanced users |
Low monthly subscription |
Steeper learning curve |
|
Bookmap |
Visual heatmaps, liquidity tracking |
Very good |
Scalping & visual flow |
Subscription |
Intuitive for beginners |
|
ATAS |
Dedicated order flow features |
Top-tier clusters |
Serious volume analysis |
Subscription |
Feature-rich |
Many traders begin with NinjaTrader’s free simulation mode or Bookmap’s trial because they offer clear visuals without overwhelming complexity. Test a few on demo data to see what feels comfortable.
Pros, Cons, and Common Beginner Mistakes
Pros:
- Gives real-time insight into buyer/seller strength
- Helps filter false breakouts and spot reversals earlier
- Works across futures, stocks, and some crypto when volume data is available.
Cons:
- Requires specialized platforms (standard charts aren’t enough)
- Can feel overwhelming at first with many numbers
- Needs screen time and practice to read patterns quickly.
Common mistakes to avoid:
- Trying to analyze every single tick instead of focusing on key levels
- Ignoring risk management or skipping stop-losses
- Trading without combining order flow with a simple price action context
- Jumping to live trading before enough demo practice.
Start small, watch one market for 30–60 minutes a day, and note imbalances or divergences you see.

Final Thoughts
Order flow trading adds depth to your analysis by showing the real forces moving the market. Once you get comfortable with footprint charts, delta signals, and imbalance patterns, you move beyond guessing and start reading the market’s actual story. Combine these tools with simple price action, stay disciplined with risk, and practice patiently. The market speaks through every order. Now, you have a way to listen more clearly.
Start today on a demo chart. Open a footprint view, watch for your first imbalance or absorption, and take notes. Consistent practice is the real edge.
Source: TradingView, BBN Times

DISCLAIMER: This blog is NOT any buy or sell recommendation. No investment or trading advice is given. The content is purely for educational and information purposes only. Always consult your eligible financial advisor for investment-related decisions.