A trend reversal in technical analysis marks the end of an existing trend and a beginning of a brand-new trend. The aim of the trader should be to take the opportunity of the reversal that can happen in any timeframe.
Trend Reversal is effective only when the stock trader can spot the reversal fast and take trade within the time limit. One should know the basics of a trend reversal, the identification of trend reversal and the chart patterns that prompt the reversal.
Therefore, read the blog post till the end to gain the learnings on trend reversal patterns.
Trend Reversal occurs due to the movement of the security’s price towards new highs or new lows. Market reversals take place when either the upper trend line or lower trend line is breached by the price movement to move in the other direction.
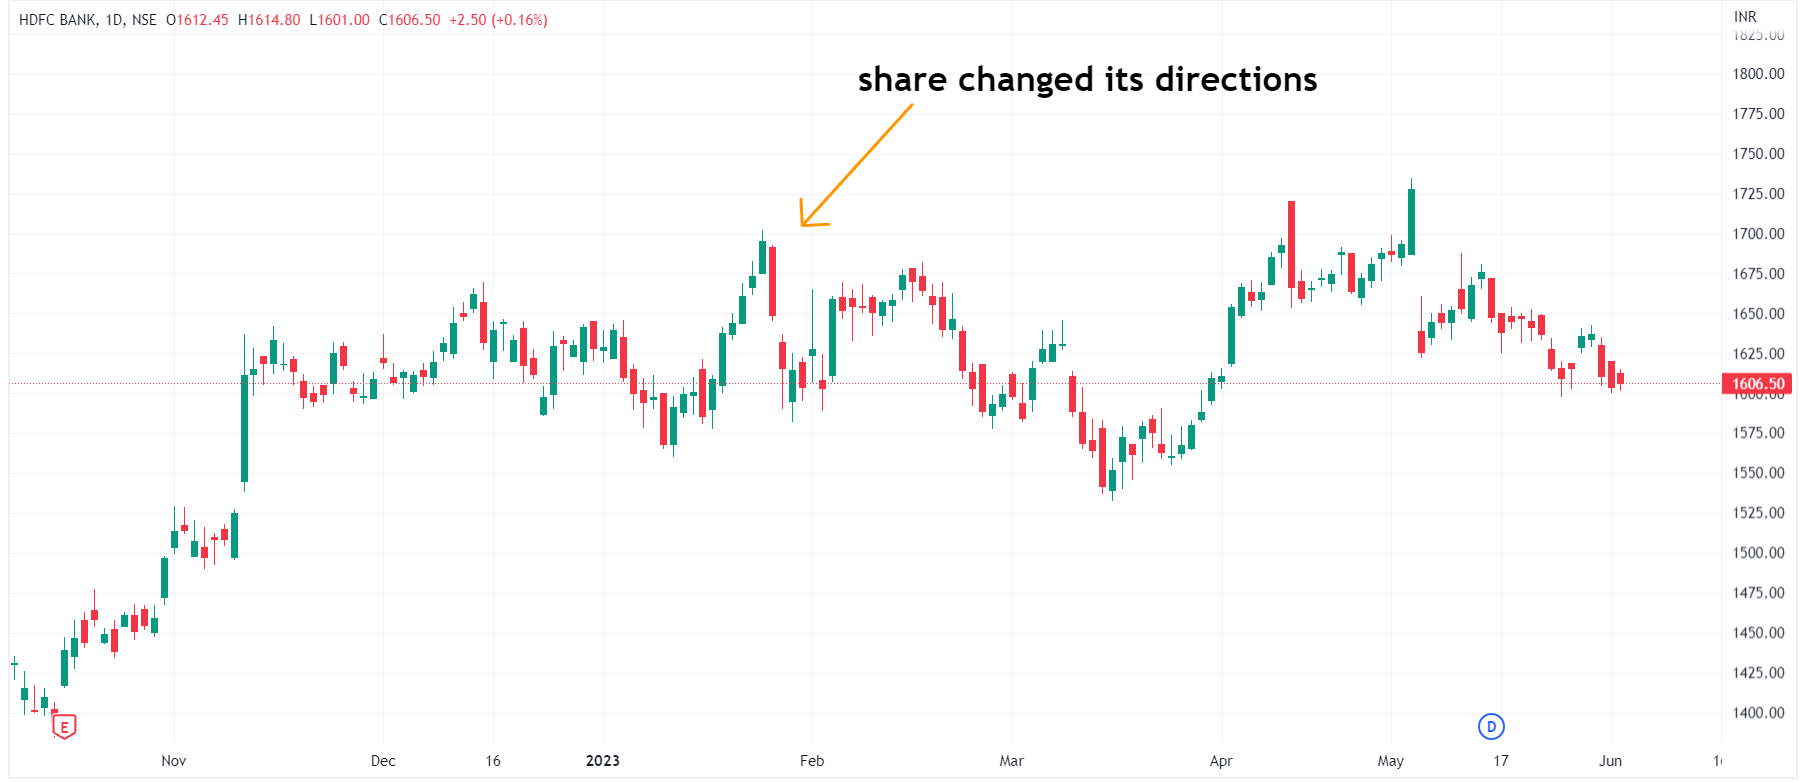
A trend reversal happens in the market when the price of the security changes its ‘direction’. Suppose the stock of HDFC is experiencing an upward trend for a week and it starts moving in the next day, this will be regarded as a trend reversal.
One must know that trend reversal also defines its meaning for different traders depending on the time frames, indicators, and strategies they are using.
Generally, traders misinterpret small changes, countermoves, pullbacks, or impulsive market moves as trend reversals which is wrong. Trend reversal takes place when it lasts for a long time and indicates a huge change in the market direction.
Identification of the Trend Reversal is crucial so that traders know the difference between pullbacks, impulsive moves, and the actual trend reversal. Let’s read the next part of this post to understand the techniques.
According to experienced traders, there are hardly any techniques that help to identify Trend Reversals clearly. However, several technical indicators available on the trading platform can help in identifying trend reversal if used correctly.
The best thing about using indicators in technical analysis is that it will show the possible areas where the trend might reverse. Therefore, one can know how to find trend reversal. Some of the methods and indicators used by traders are:
2.1 Moving Averages
Moving averages are the common indicators used by technical analysts to perform their analysis on stocks. But do you know that it also helps in identifying trend reversals?
Well, now you do!
Moving averages include simple moving averages and exponential moving averages that observe the price movement to identify the potential trend of the stock. The moving averages keep the track of the trend analysis in stock market and allow traders to find the reversals on the spot.
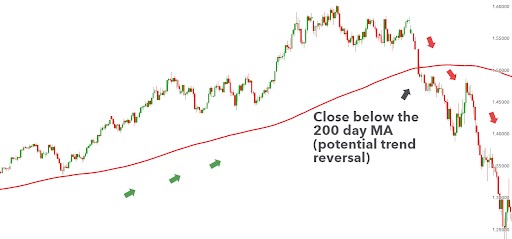
For instance, you can choose Moving Averages from 20-day, 50-day to 200-day for finding the potential trend reversal sign.

2.2 Trend Lines
Trend Lines are drawn on charts to identify the trend reversal meaning visually using support and resistance levels. Trendlines can be diagonal or horizontal which helps in identifying the reverse signals from the stock.
The upper area of the trendlines drawn acts as resistance to the price and the lower area of the trendlines drawn acts as support. For a trend reversal to take place, the lower or upper trendlines will be breached when the price starts moving in a certain direction.
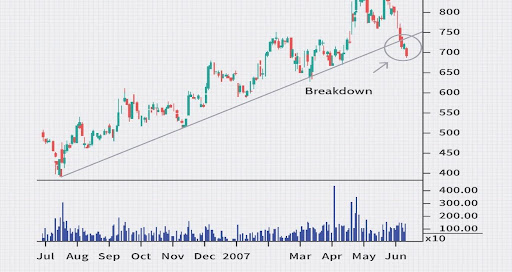
For instance, you have drawn a trendline on a price chart where it is in an uptrend for 15 days. On the 16th day, the downtrend starts, and the price breaks the trendline which is a potential signal for trend reversal.
However, how long the trend will stay in the reversal or bounce back depends on several other factors and it is necessary to use other indicators as well.
To understand trading in Trend Reversals, you need to prepare a trend reversal setup that helps you level your trading-taking aspect. The following trend reversal trading strategy guide will assist you in learning:
Three trading setups that help you work on trading in trend reversals are support & resistance, breakout, and pullback.
3.1 Support & Resistance
A trader should develop a setup that offers favourable risk to reward using a support and resistance strategy. Look for an accumulation area which is a support zone that invites entry for the buyers.
If the market breaks out of an accumulation stage, the traders who went long in the support zone make a profit out of it. Thus, entering the earliest stage of the movement will help the traders to receive a potential reward.
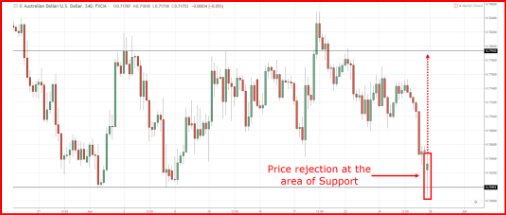
One disadvantage that remains in this strategy is that the price may not re-test the support area.
3.2 The Breakout
The second trading concept is when a trader waits for the security to break out to a higher price to enter the trade. This move is developed when the market starts moving from the accumulation stage to the advancing stage. The breakout is an opportunity to take advantage of the high prices.
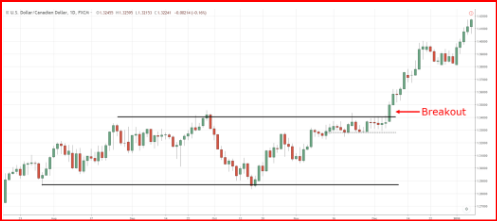
A disadvantage remains in this system where it could lead to a false breakout.
3.3 The Pullback
The last trading aspect during trend reversal would be to wait for a pullback while waiting to enter the trade. When the breakout happens, soon after that there is a chance that pullback can take place.
Thus, when the price retraces to the previous resistance turned support level, it forms a bullish candlestick pattern that indicates your entry into the stock.
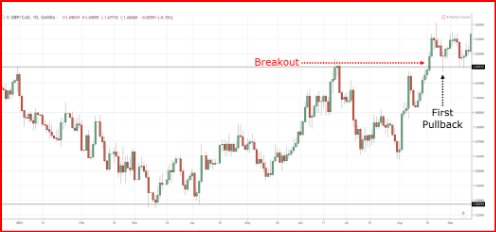
The risk is present here when the pullback might never occur after a breakout.
Reversal patterns indicate a probability that the trend has come to an end and will reverse in another direction. Double tops and head & shoulders patterns are the two reversal patterns that help in identifying a trading range.
4.1 Double Tops
The double tops pattern is formed at the end of an uptrend in an ‘M’ shape when the price reaches the previous resistance level. This is a potential reversal trend pattern because on reading the level of resistance, the price cannot break the resistance.
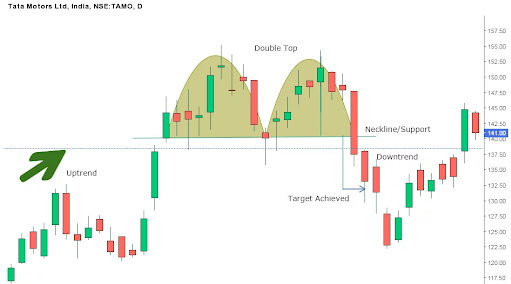
Remember that the entry point in this chart pattern will be when the price moves below the low between the two peaks. The double top pattern receives a confirmation when the support is broken and indicates a reversal from it. Breaking the neckline will continue the downtrend in the stock.
4.2 Head and Shoulders
The second trade formation in trend reversal is presented using head and shoulders. This is one of the most reliable patterns if a trader is looking for trend reversal pattern. Head and shoulders are formed usually at the end of an uptrend with a reversal aspect.
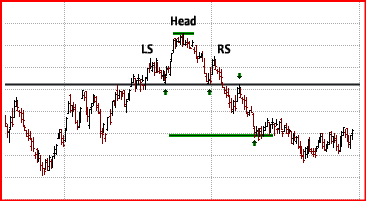
A head and shoulder pattern are formed with three highs during an uptrend or three lows during a downtrend that forms a left shoulder, right shoulder, and the head. It is a reliable reversal pattern for traders. This trend action provides a measurable price target and price projection for the traders to enter the stock.
p dir="ltr">

Conclusion
It is concluded that trend reversal patterns denote the change in direction of the index, security, or any asset. One can identify trend reversal using trend lines, moving averages and more indicators. Further, traders can trade in trend reversals using support & resistance, breakout and pullbacks formed on the chart. Accurate analysis and entry points can help traders to find the balance during trading. Finally, the formation of trend patterns such as head and shoulders or double top can result beneficial during a trend reversal.
Key Takeaways
-
A trend reversal happens when the price of the security changes direction/trend
-
Moving averages helps traders to find the trend direction
-
Trend lines helps traders to mark the area of potential trend reversals
-
Support and Resistance is used to enter in the trend during an accumulation stage before reversal
-
Traders wait for a breakout to enter while the price moves to advancing stage
-
Traders can also make an entry during a pullback after the breakout
-
Double tops and head and shoulders are the reversal patterns on charts