In technical analysis, continuation patterns are the chart patterns that provide a ‘direction’ to the original trend. Traders look for trend continuation to be able to stay in the market for a long time.
In this blog, we will explain the meaning of continuation patterns in depth and explain the types of continuation patterns which you can learn to find the continued trend in the charts.
1. What is a Continuation Pattern?
When the market is trading in between trends, it is critical to enter or exit a trade that has no direction in the trend. A trend continuation pattern in technical analysis is a pattern that signals the continuation of a trend.
Assume that when you will enter into a trade and that trend carries out for a long time, it is a continuation of the trend. Traders aim to find patterns like rectangles, triangles and many shapes to detect the continuation patterns.
2. Types of Continuation Patterns
2.1 A bullish Continuation Pattern occurs in the market when the price action accelerates to form a specific pattern after a strong uptrend. When the price sustains the consolidation phase, it is assumed that the continuation of the uptrend is secured.
2.1.2 Ascending Triangle
An ascending triangle is a continuation pattern which occurs in the mid-trend to signal the continuation of an existing trend. The increasing pattern as the triangle is formed by drawing two converging trendlines as per the figure.
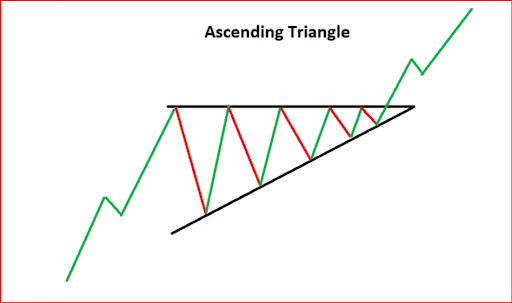
One of the trendlines is known as the flat upper trendline and another is the rising lower trendline. In this situation when the price moves in a certain continuation direction, traders look out for an opportunity for a breakout with ascending triangle trading.
2.1.3 Bullish Rectangle Pattern
The rectangle pattern in continuation bullish rectangle is formed when the price moves sideways in between parallel support and resistance. A bullish rectangle pattern forms a trading range during sideways trading. The pattern is easily identifiable as it shows two comparable lows and highs in the formation of the pattern.
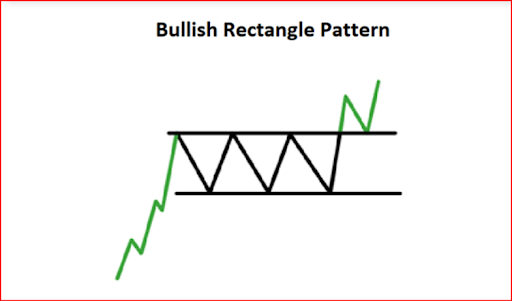
Traders have the opportunity to trade in both within the range and after the breakout which is interesting with this continuation pattern.
2.1.4 Bullish Flag
A bullish Flag Pattern is a continuation pattern that helps traders to master the moves. It is known as a bullish flag chart pattern because it resembles the flag on a pole. It shows a sharp rising effect on the stock followed by an up-and-down trading pattern.
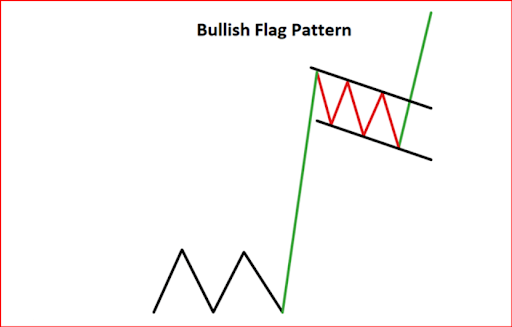
The downward sloping channel formed as a flag is a paused moment form a continuation trend which is continued later with a breakout. The two parallel trendlines denote the preceding trend taking place.
2.1.5 Bullish Pennant
A bullish Pennant pattern is a continuation chart pattern that experiences a sudden upward movement and develops during a consolidation period.
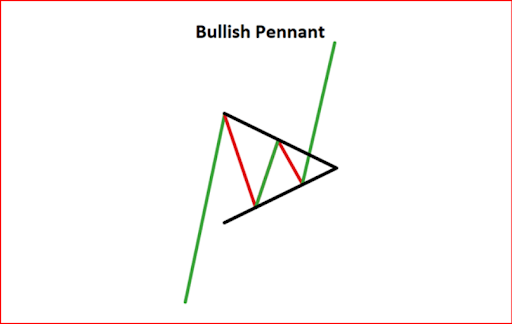
As per the figure, you can observe that a triangular pattern is formed which is known as a pennant and it shows the consolidation followed by a sudden upward movement.
2.2 A bearish continuation pattern occurs when the market extends towards the downtrend and continues for a while. If it sustains the consolidation, the bearish continuation pattern will continue or if the buyers can push the price, then reversal will take place.
2.2.1 Descending Triangle
A descending triangle is an opposite of what we learnt above as ascending triangle. In this formation, the price tends to move downward due to its bearish aspect.
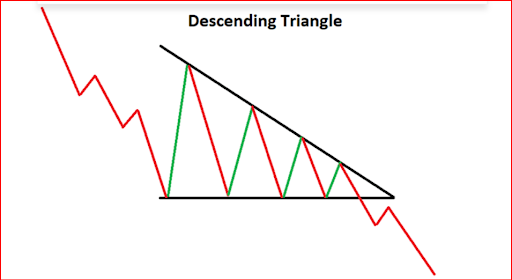
The descending triangle breakout can be drawn by converging two trendlines in continuation of an existing trend, signalling that the trend will continue further. In the formation of the descending triangle, traders look for small breakouts to enter into the trend in expectation of a fall.
2.2.2 Bearish Rectangle Pattern
The bearish rectangle pattern denotes a ‘pause’ in the trend because the price on the chart moves sideways for quite some time. A parallel support and resistance zone is formed with a bearish rectangle pattern.
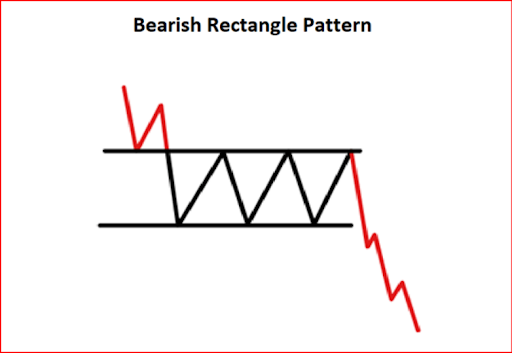
The original trend is downwards which consolidates in the form of a rectangle pattern and then moves back to the original direction of the trend. It is a strong downtrend continuation where the price temporarily bounces back to allow traders to enter.
2.2.3 Bearish Flag
A bearish Flag is associated with the explosive move that continues a strong downtrend on the chart. The flags are determined by the two parallel lines in an upward-slanting shape that invites buyers to enter falsely. The flag gets completed in a shorter time and records a downward move instantly.
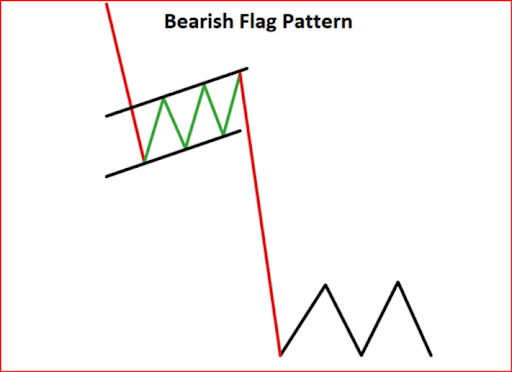
Once the temporary pause within the parallel lines is finished, traders can observe a downtrend which is a bear flag trend pattern. The flag pattern helps in pushing the price further down to help the bearish traders make profits.
2.2.4 Bearish Pennant
Bearish pennant is one of the important continuation trend patterns that appears when the price experiences a sudden drop from its movement. This pattern develops the shortest consolidation pattern and moves low down continuously.
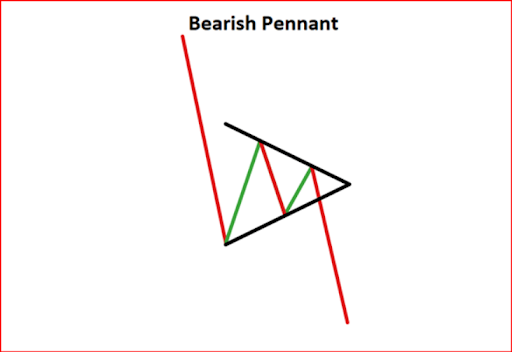
Bearish Pennant is a technical trading pattern which depends entirely upon the downward movement. A significant move up happens that strikes to fall further beyond the trading price.
Conclusion
Trend continuation pattern showcases future price movement which adheres to bullish and bearish movement as per the patterns. In this blog, you learned that different continuation patterns help you identify a trend which continues to trade in a certain direction.
Traders should follow these continuation patterns based on a strict stop loss to save themselves from a false breakout. Continuation patterns are similar for stocks and forex trading, make sure to implement the risk and reward before following a trend pattern.
Key Takeaways
-
Continuation patterns trade in a similar direction and continue the price movement.
-
Two types of continuation patterns: Bullish and Bearish Patterns.
-
The ascending triangle formed using two converging trendlines and continues the bullish trend
-
Descending triangle occurs mid-trend and moves sideways to continue the bearish trend
-
Bullish Flag is a downward-sloping channel that continues an upward trend
-
Bearish Flag shows explosive downward moves before and after the formation of the flag.
-
A bullish pennant is formed in sudden upward movement after a short consolidation.
-
A bearish pennant is formed in sudden downward movement after a short consolidation.
-
A bullish rectangle develops consolidation with a support and resistance parallel pattern.
-
A bearish rectangle indicates consolidation with support and resistance zones to follow the downward movement.


