Trading in stock markets is easier when one analyses the trend of the market. The blog will focus on understanding trends from the basics and identifying the trends of the market.
In the current scenario, individuals are working on purchasing and wearing things that are trending in the market. When was the last time you thought to buy a certain product just because it is in ‘trend’?
Well, in stock markets we do the same! When a stock shows trending signs, we trade in them to make money. A trend is a scenario that either attracts buyers or sellers to keep up with the stock price.
A ‘trend’ is the direction of the market or a security movement. Traders opt to analyse the trend through trendlines or focus on price action with recent trend in stock market.
To understand the trend, a trader should observe the lower swing lows and lower swing highs for a downtrend whereas, higher swing highs and higher swing lows for an uptrend.

To perform trend analysis in the stock market, one must understand the directions of the trend, trend lengths, trend lines in stock market and the movement considered for the trend. The figure above showcases a trendline in increasing price formation.
Trend lines are the lines drawn in technical analysis to show the prevailing direction of the price movement. You should know that trendlines are drawn to connect two or more price points to connect the highs and lows forming the trend.
A trader understands the price movement by drawing several types of trendline in an attempt to sense the price direction in the stock’s chart. You can spot a trendline in the following figure.

A trend line can be further divided into two types – uptrend and downtrend lines. These are the two directions of the trend where a trendline
To completely grasp the concept of trend, the trend length should be analysed and used in technical analysis. Trend lengths are derived from the principles of Charles Dow which is known as the Dow Theory – a study of technical analysis.
According to Dow, the prices always move in waves or trends. He believed in the study by comparing it to the ocean waves, which move as rising tide and low tide with ebb and flow. Similarly, the trends in pricing of stock markets have peaks and troughs that form the length of the price trend.
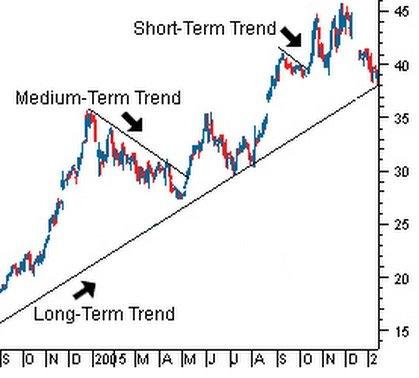
Trend lengths are of three kinds: long-term, intermediate, and short-term. Dow’s explanation supports the long-term movement as 1 year or longer with the tides, intermediate movement as 1-3 months with the waves and short-term movement as less than 1 month compared with the ripples.
In technical analysis, the time affects the trend lengths which can have larger or shorter rallies, larger or shorter retracement and so on.
is drawn to support the movement and predict the next direction of the price.
The stock market has three kinds of direction – uptrend, downtrend and sideways.
Trends showcase the direction where a price moves in the market, hence the three kinds portray when the price moves up, the price moves down, and the price moves sideways.
A trader must know about trend analysis which is an important aspect in deriving the tools and techniques of technical analysis.
4.1 Uptrend
An uptrend describes the upper price movement where the successive peak and through are higher than the previous ones.
This is a consecutive movement where the peaks and troughs are formed above the previous highs of the price.
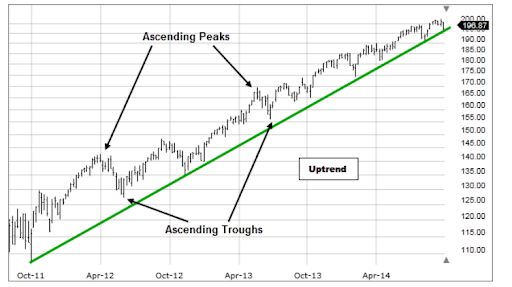
It is also known as ascending peaks and ascending troughs. The trend direction in upper movement is made through higher highs and lower lows.
An uptrend line is a trend line drawn straight toward the up-right to capture the increasing price of the stock. The uptrend movement is shown using the uptrend line where it is perceived that demand is higher than supply.
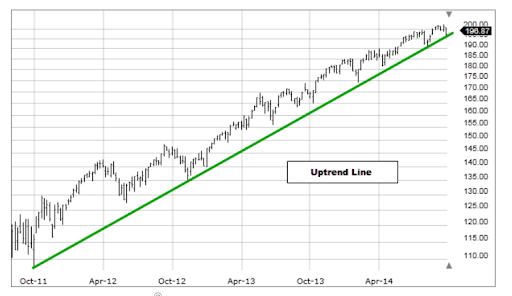
As shown above, the figure demonstrates a clean uptrend line which shows ascending troughs (lows) and is connected to the trendline.
Draw an Uptrend Line
-
Open a chart that shows increasing price movement.
-
Drawn an uptrend line using two or more lows
-
Draw a straight uptrend line that connects all the lows in ascending orders on the right.
If the prices remain above the trendline, the trend is considered solid. However, if the price movement breaks the trendline, the stock can expect a reversal.
4.2 Downtrend
A downtrend movement signifies a bearish direction of the trend which forms in contrast to the uptrend. In financial markets, the downtrend is a tendency to move below the previous lows of the price movement.
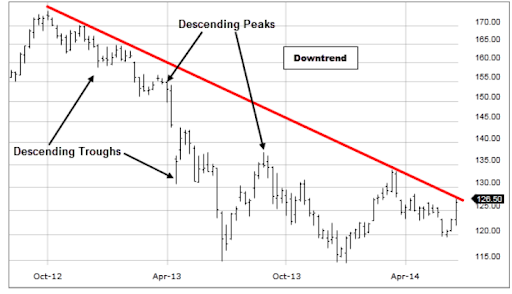
As per the figure, the downtrend showcases descending troughs and descending peaks in the price movement of a chart.
A downtrend line is drawn straight towards the down-right which connects more than two high points. It acts as a resistance to the price movement and indicates higher supply than demand.
Ensure that the downtrend line is touching more high points to make it more reliable and valid. As per the figure below, you can spot the downtrend line connecting more than four highs.

If the downtrend line breaks, it indicates that there might be a possible reversal towards the upper side. A change in trend will take place only when the trendline is broken with the price increase.
The downtrend line is an important aspect of trend line analysis as traders are more likely to square off their position when the trend breaks.
NOTE: Ascending direction shows uptrend and descending direction shows downtrend in the market.
4.3 Sideways
Sideways in the market are formed when the price of the security trades in a limited range without forming any higher or lower range in the chart.
In the price movement of the chart, when you find no possible clear trends, it is implied that the market or security has gone sideways.
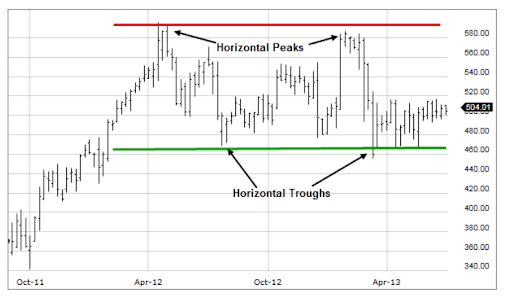
A sideway market is also known as consolidation that moves with an indicator for sideways market and in a horizontal range with horizontal peaks and horizontal troughs. It implies that the demand and supply forces are nearly equal in the market which makes the price move horizontally.
Conclusion
Using trend – uptrend, downtrend, short-term trend, and long-term trends are crucial for a trader. We hope that you find this helpful while trading. Trends serve as an opportunity and a warning too. One must essentially learn to draw a trend line that uses additional tools to predict the market significance.
Key Takeaways
-
A trend is a ‘direction’
-
Uptrend direction is formed by ascending peaks and ascending troughs
-
Downtrend direction is formed by descending peaks and descending troughs
-
A market goes sideways with horizontal peaks and horizontal troughs
-
Trend lengths are long-term, intermediate, and short term
-
Long-term – More than 1 year
-
Intermediate – 1-3 months
-
Minor – Less than 1 month
-
A trendline connects two or more price points
-
An uptrend line connects 2 or more low points
-
A downtrend line connects 2 or more high points


