A Complete Guide to types of Candlestick Patterns
Candlestick Patterns are time-tested, easier to spot, and essentially used in stock markets during trading.
Candlesticks are used to identify the trading patterns that form during the price action. A candlestick pattern is formed using two or more candles, with different sequences for different patterns. However, few candlesticks’ patterns are formed powerful even with a single candle.
Here, in this blog post, we will take you through several candlestick patterns from basic to advance to determine the price direction and momentum of several stock prices.
Doji Candlestick Patterns
Doji is one of the important candlestick patterns that are popular and widely used by traders during trading. Doji candlestick pattern meaning there is confusion in the market or for the stock, as the buyers and sellers are fighting over the price.
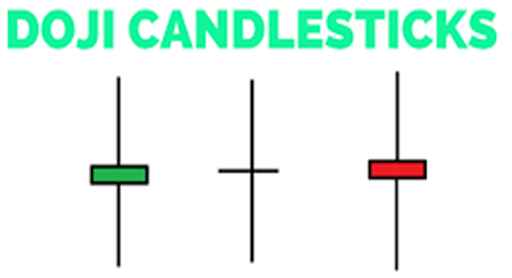
Traders should note that this candle’s open and close price will be the same because the movement and pressure are from both seller’s and buyer’s sides. As shown in the figure, the candle will form with a large wick and a small real body.
The major 3 candlesticks patterns of doji are :
1. Gravestone Doji
A strong bearish push is observed from the candle indicating a reversal towards the downside. It indicates a heavy bearish signal.
2. Dragonfly Doji
This is a powerful candle as it denotes a potential reversal of security’s price.
3. Long-legged Doji
it has long lower and upper shadows and denotes that opening and closing prices are the same.
Types of Candlestick Patterns
A candlestick pattern is a way to interpret the charts, but know that it is not the only way as there are several patterns such as line charts, Renko charts, bar charts etc.
A technical trader should understand that candlestick charts are the most popular technical pattern which helps in quickly analysing the price patterns and shapes formed during reversals and continuations.
1. Single Candle Patterns
Candlestick patterns form single candlesticks that are the simplest pattern you can find during trading. The patterns that form using a single candle form the building blocks and initiate longer patterns. Mostly single candle patterns are reversal candlestick patterns. Like hammer, hanging man, shooting star, and spinning top.
2. Hammer Candlestick Pattern
Hammer is one of the most important patterns formed in candlestick charts, which is in focus by several traders and investors during trading.
A trader should learn what is hammer pattern is essentially. Hammer pattern is formed at the end of a downtrend and begins to signal a bullish trend in the market. So, this why this pattern is called bullish candlestick pattern.
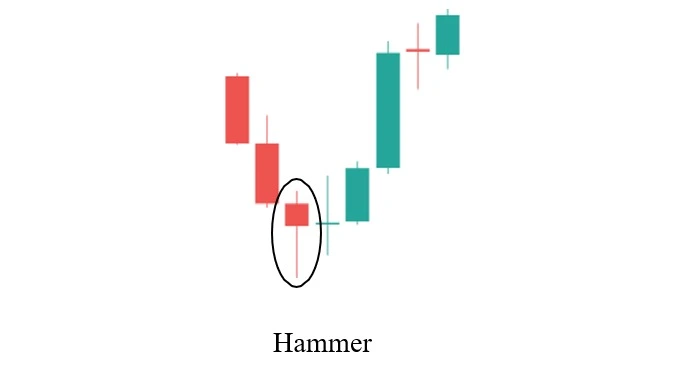
The candlestick chart pattern forms a hammer when there is a push from the buyers to take the market to new heights.
3. Hanging Man Candlestick Pattern
A hanging man pattern is a type of candlestick pattern that creates the candle’s shape with the objective of a potential reversal in the trend. This why we can also call this bearish candlestick pattern.
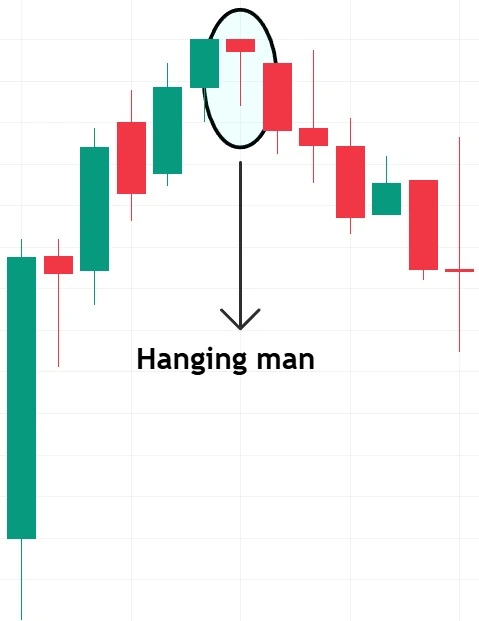
A trader should look for long lower shadows and a small real body to observe a hanging man pattern. It appears at the end of an uptrend and increases the weaknesses during the price movement of the security.
4. Inverted Hammer Candlestick Pattern
An inverted hammer is known for its bullish reversal pattern which signals that the stock price is entering and making a bottom for a potential downtrend. So, this why this pattern is also called bullish candlestick pattern.
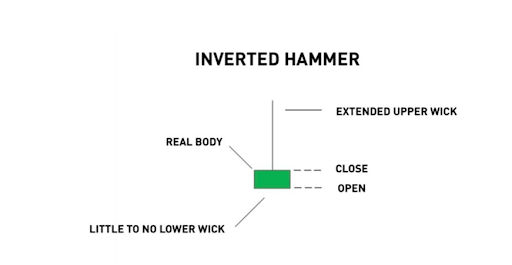
It is a single candlestick pattern, and it makes the opposite version of the hammer candlestick pattern. Traders should ascertain that when a downtrend is shown in the shape of a hammer and a bullish (green) candle, it is termed an ‘inverted hammer.
5. Shooting Star Candlestick Pattern
A shooting star candlestick pattern forms a long upper shadow and little or no lower shadow as a bearish candle. It creates a small real body near to the day’s low price. Generally, it appears after an uptrend. Shooting star is bearish candlestick pattern.
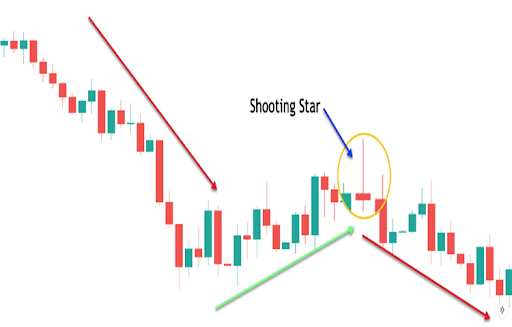
It forms an upper shadow which is at least twice the formation of the real body and ascertains the declining price of the stock price
6. Spinning Top Candlestick Pattern
As learned before about the Doji pattern, the spinning top is similar in context as it shows indecision in the market as well. It is a continuation pattern where the buyers and sellers fight over the price for a long time.
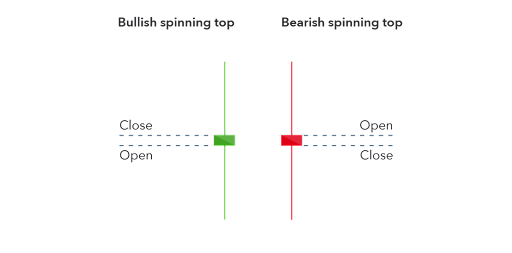
The only difference between a Doji and a spinning top is that the candle’s body is larger than in the spinning top. Traders are advised to wait during a Doji or spinning top candle movement. This candle pattern is called bullish and bearish candle pattern both. If spinning top form at the top called bearish and if it forms at the end of downtrend then called bullish candle pattern.
7. Marubozu Candlestick Pattern
A Red Marubozu pattern indicates that the stock is trading strongly in a single direction. The candle which forms the red marubozu is a large candle with 0 wicks on either end.
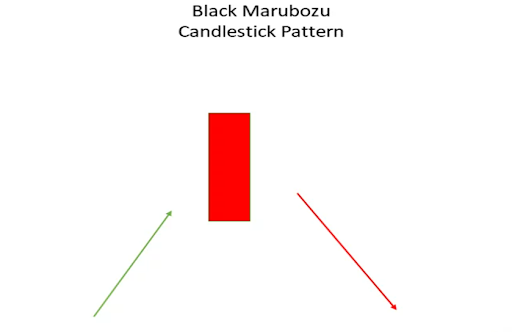
The red marubozu candle is very bearish and indicates a continuation of the bearish trend in the stock or indices.
A green marubozu forms a single candlestick pattern indicating a bullish reversal from a completed downtrend.
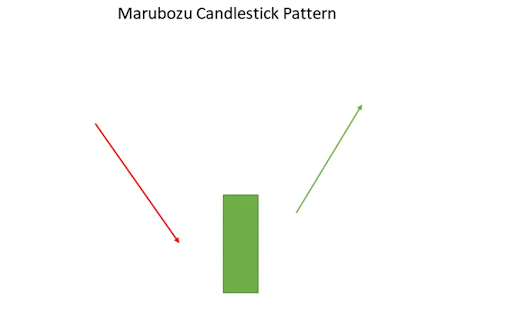
A marubozu candle has no lower or upper shadows as it is a long bullish or bearish body formed to signify the buying and selling indication.

Double Candlestick Patterns
1. Bullish Engulfing Candlestick Pattern
Bullish engulfing indicates a rise in buyers and buying pressure if it forms in a stock’s technical chart. This pattern reverses the present or ongoing trend when a lot of buyers enter the market.
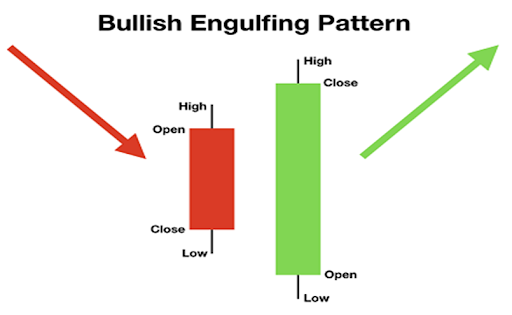
A trader should know that bullish engulfing forms using two candles where the first candle is short and bearish which is engulfed by the second candle of the bullish or green candle.
The bullish candle in this pattern opens lower than the first candle’s close and closes above the first candle’s opening.
2. Bearish Engulfing Candlestick Pattern
When multiple candlestick patterns form during an uptrend and indicate a bearish reversal, we can call it a bearish engulfing pattern.
A bearish engulfing candle forms with two candles where the first candle is bullish, and the next candle engulfs the first candle with a bearish approach.
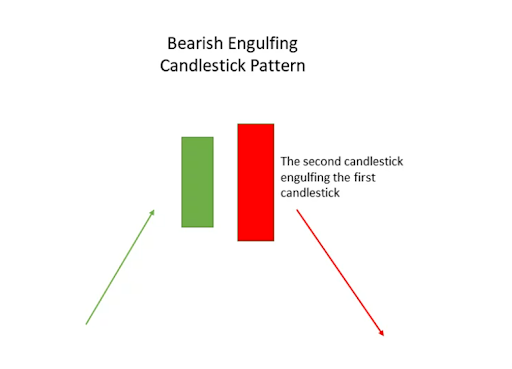
In easy language, the second candle covers up the size of the first candle which forms the engulfing nature. It indicates that bears are back in the market and a bearish pattern will start to form.
3. Bullish Harami Candlestick Pattern
This is a candlestick pattern which indicates a bullish signal right after a downtrend or bearish momentum. Traders opt for this pattern to analyse the trend reversal towards positive sentiments in the market.
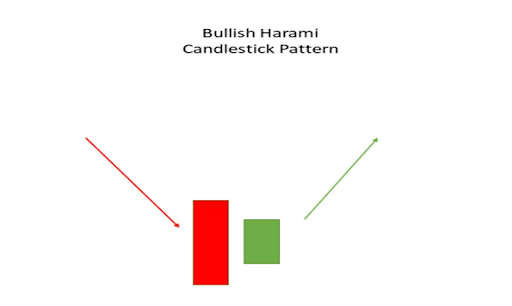
There are two candles formed in a bullish harami pattern where the first candle is long and bearish, whereas the second candle is short and gives a bullish signal. Traders are advised to take a long position with a bullish harami pattern.
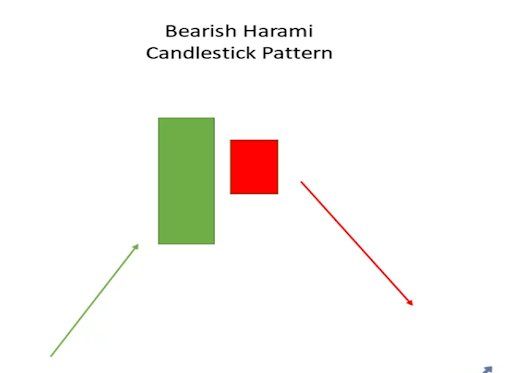
4. Bearish Harami Candlestick Pattern
A bearish harami pattern consists of two candlesticks where there is one tall bullish candle and a short bearish candle.
The candlesticks are formed in a way that indicates that the market was bullish at first, but the inclusion of a small bearish candle shows the entry of bears into the market.
5. Dark Cloud Cover Candlestick Pattern
A dark cloud cover is a bearish candlestick pattern where a red or bearish candle opens above the close of the first green or bullish candle and closes below the midpoint of the red candle.
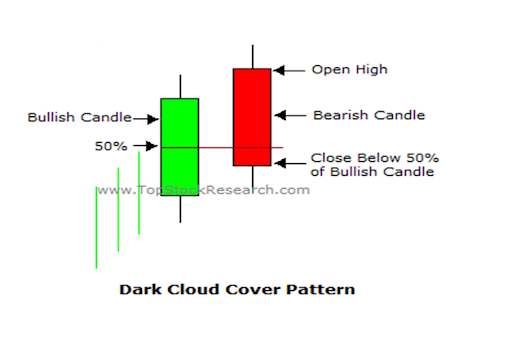
It is a two-candle pattern that showcases trend reversal and is effective when it is found during a potential uptrend. The first candle is green and bullish whereas the second candle is red and bearish. You should remember that the red candle opens above the green candle and closes above the bottom of the green candle as well.
According to several traders’ views, the dark cloud cover pattern does not show a strong signal for bearish movement in comparison with a bearish engulfing pattern, nonetheless, it is a potential indicator to save your trade before a reversal.
6. Piercing Candlestick Pattern
The piercing line pattern is a two-candle pattern that is effective when found during a downtrend and it is seen as a bullish reversal candlestick pattern.
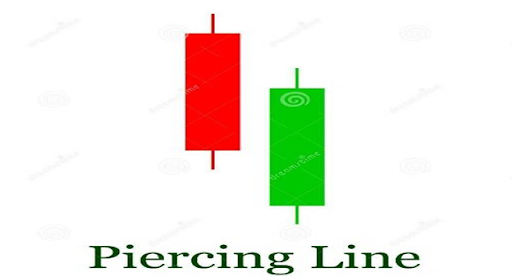
A piercing line pattern is a bullish reversal pattern where the first candle is red or bearish and the second candle is formed lower than the first as a bullish or green candle.
Triple Candlestick Patterns
1. Evening Star Candlestick Pattern
The evening star signals a bearish trend with its candlestick pattern, where the first candle is in a bullish trend, the second candle forms a Doji suggesting indecisiveness in the market and finally, the last third candle increases selloffs in the market indicating a bearish trend.
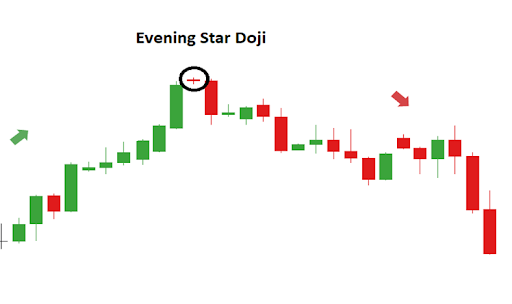
Remember, you will use this candlestick pattern to find a reversal trend in the market. When the third candle starts the bearish trend, the buyers find it hard to sustain in the market, thus, with no buyers, there is a heavy sell-off generated.
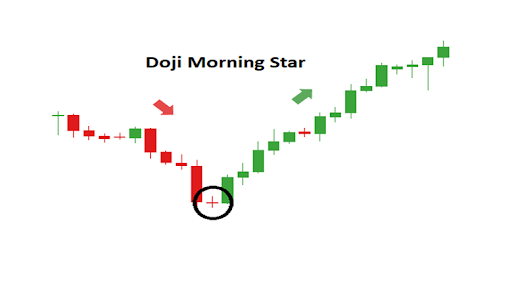
2. Morning Star Candlestick Pattern
The morning star candlestick pattern is the opposite of the evening star as it indicates a bullish reversal from the red candles. It is also made up of 3 candles that show:
-
First candle – downtrend and sell-off in the market
-
Second candle- the creation of the Doji candle indicates indecisiveness
-
Third candle – Increase in bullish movement with low intensity of sellers
3. Inside Down Candlestick Pattern
The inside down candle is a bearish reversal pattern candlestick formed using three candles – composed of two large up candles and one small down candle.
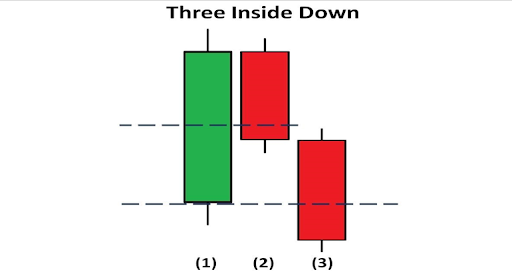
It indicates bearish movement in the market when you spot it on charts. The first candle is long and green, the second candle is long and red, and the third candle is smaller than the first two candles with a red body.
4. Inside Up Candlestick Pattern
The 3 Inside Up pattern is a bullish reversal pattern which consists of a specific sequence of three candles indicating that the trend might form a positive momentum.
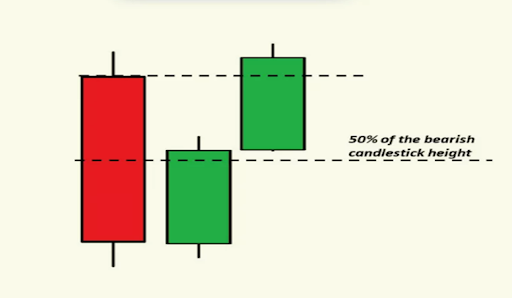
In the 3 Inside up pattern, the market must be in a downtrend leading to a bullish pattern with a large body red candle, a down candle and an up candle with 50% above the bearish candlestick height.
Continuation Candlestick Patterns
1. Bearish III Continuous Candlestick Pattern
The bearish falling three methods is a continuation pattern that occurs after a downtrend of the price action. A strong move is developed when the first candle is followed by two to four candles. It is known as bouncing action that leads to a breakout.
Remember that it is a bearish four to five-candle continuation pattern which does not signal reversal but indicates an interruption during the downtrend
.
2. Bullish III Continuous Candlestick Pattern
Bullish falling three continuous patterns is a super strong pattern which is used while assessing technical charts for identifying divergence, breakouts, or growth.
Bullish Rising three methods forms with a long green candle followed by three shorter and decreasing candles. The three candles in between show the actual resistance of the trend and might involve a price reversal.
In conclusion, there is various candle formation that shows the bearish and bullish formation and reversals that helps a trader in identifying a trend. From a single candle formation to five candle formation, a trader can attempt to take trades.
Key Takeaways
-
A hammer pattern is formed at the end of a downtrend and begins to signal a bullish trend in the market
-
A shooting star is a candlestick pattern that forms a long upper shadow and little or no lower shadow as a bearish candle
-
Difference between Doji and spinning top is that the body of the candle is larger than in the spinning top
-
Bullish Engulfing means rise in buyers & buying pressure
- Bullish Harami is a candlestick pattern which indicates a bullish signal right after a downtrend or bearish momentum
-
Bearish Harami is a candlestick pattern which consists of 2 candlesticks where there is one tall bullish candle and a short bearish candle.