Heikin-Ashi (HA) is used by traders to make an informed decision on whether to enter or exit a trader. It is a type of price chart that uses averages to determine the market trend with the price movement of the asset.
What is Heikin Ashi Candle?
Like other candlesticks, Heikin Ashi candles include four points – high, low, open and close prices, the only difference is that it also uses data from the previous sessions and the current session to finalize the values.
Hey! It’s okay if you haven’t heard about Heikin-Ashi before, we are here to tell you in detail with a thorough understanding of it. Just read this blog and you will be able to analyse the candlestick trend more clearly.
Heikin Ashi candlestick was invented by Munehisa Honma during the 1700s who also developed the traditional candlestick pattern. HA is a trading indicator started using by the Japanese to determine the average pace.
This candlestick pattern is based on values for each candle that forms during a price movement. It filters out the 'noise' from the chart and results in clear entry and exit points. The candlestick pattern was developed by the Japanese trader to capture the market trend distinctly.
Historically, the Japanese trader wanted accurate price movement for its rice business and receiving false trading signals was creating disturbance for its price movement. Therefore, Heikin Ashi was introduced as a technique to reduce false trading signals and develop valid signals from the candlestick pattern formation.
Now, that you know the history, let’s hop on to understand, after all how to use this pattern.

To use a Heikin Ashi Chart for your trading aspects, you need to remember the Heikin Ashi formula, read the candlestick patterns and trade them using the chart.
2.1 Heikin Ashi Formula
Heikin Ashi trading strategy includes a formula method that helps you figure out the trend of security through individual candles. We understand your insecurity about knowing and implementing a formula, but trust us, it is one of the easiest and most useful formulas to learn in technical analysis.
Heikin Ashi Formula
-
Open Price = Open + Close (Previous Bars) / 2
-
Close Price = Open + Close+ High+ Low (Current Bar) / 4
-
High Price = The maximum value derived from high, open, and close of the current period
-
Low Price = The minimum value derived from the low, open, and close of the current period.
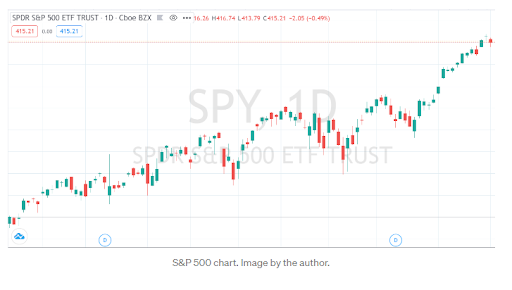
Let's see a chart that indicates plain candlesticks with a lot of gaps in daily trading. In this situation, it is difficult to make decisions on trading.
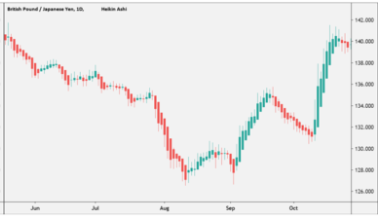
After implementing the Heikin Ashi formula, the calculation is presented from the data of both the current and previous period candles. This produces continuous candles and seamless price actions. The following chart fills up the gap and helps in better prediction during trading.
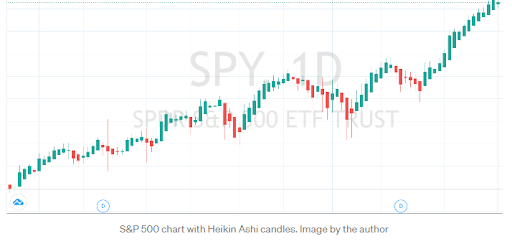
Thus, using the Heikin Ashi formula can help traders to read the chart easily with average price determination.
Further, we will explain where to look and what to understand while reading Heikin Ashi candlesticks.
2.2 How to Read Heikin Ashi?
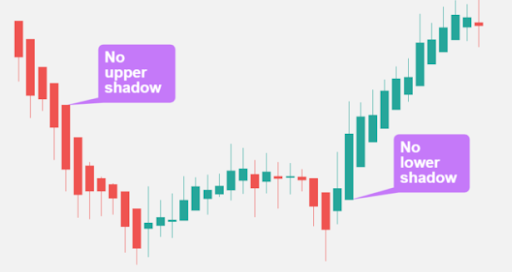
When you have a readable and organized chart after implementing the formula of Heikin Ashi pattern, you should look at the candle for its colour, wick, and body.
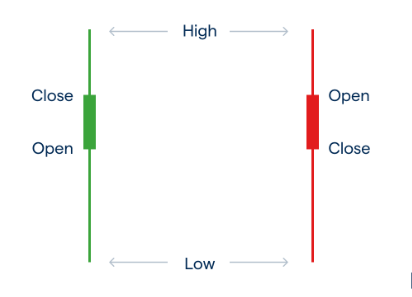
Just like Japanese traditional candlesticks, Heikin Ashi depicts the trend through the short and long identification of the wick. The smaller the wick, the stronger the trend. The top of the wick (as per the diagram) shows the highest value, and the lowest value is shown from the lower wick.
A green candle is a bullish identification and if contains no lower shadow, it signals a strong uptrend. Similarly, a red candle of bearish identification with no upper shadow signals a strong downtrend in security.
Heikin Ashi shows the market trend with the help of its lower wick or shadow. Traders can identify the momentum using Heikin Ashi chart formation in security.
2.3 How to Trade using Heikin Ashi?
Heikin Ashi charts are calculated uniformly to bring out its averages and price movement that diminishes the noise of the market. There are a few ways that help traders to trade through the Heikin Ashi chart simply.
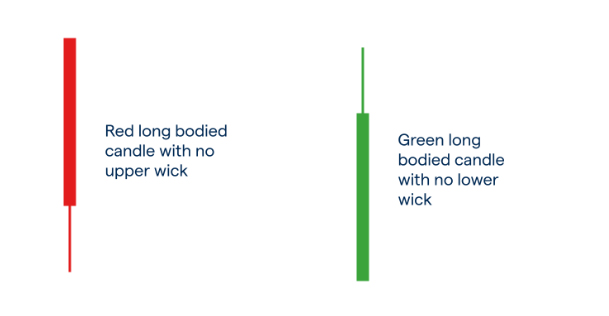
A long-bodied green candle with no lower wick indicates a strong uptrend and a long-bodied red candle with no upper wick is considered a strong downtrend. Traders use these candles to identify Heikin Ashi candle formations.
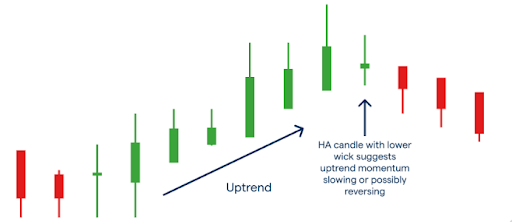
Traders who have bought securities as per the green candle with no lower wick should hold their positions until they find the formation of a lower wick in the candles which is the first signal for reversal.
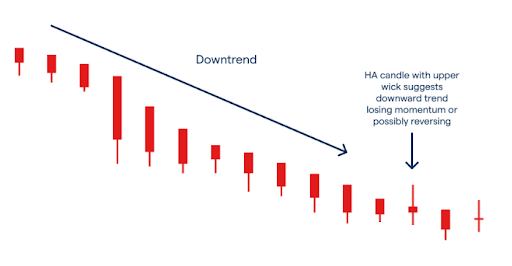
Similarly, traders who have sold the securities from the indication of the red candle with no upper wick should keep the short position until they receive the formation of the upper wick from the next candles.
A downtrend can be observed as per the chart above when there is a start of upper wick formation in the HA candle.
You will notice that the Heikin Ashi formation tends to stay green for a longer formation during an uptrend and similarly stay red for a downtrend. The longer movements help traders to identify HA formations and the chart displays the price movements for traders to trade easily.
3. Advantages Disadvantages of Heikin Ashi
You must be in doubt about using Heikin Ashi when you are already habituated to using traditional Japanese candlesticks for your trading.
Worry not! We are here to guide you about the advantages that Heikin Ashi candlestick patterns bring to the table.
|
Advantages |
Disadvantages |
|
|
|
|
|
|
Heikin Ashi might have several advantages, but it has a few disadvantages as well. With minimum weaknesses in the candlestick patterns, traders are advised to trade cautiously.
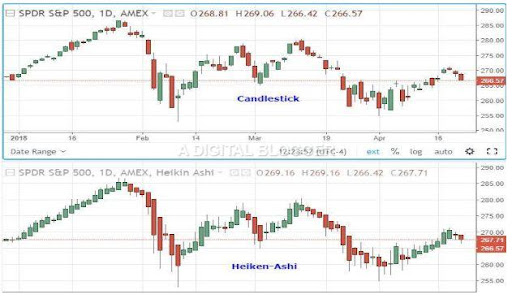
4. Heikin Ashi Candlestick vs Traditional Japanese Candlestick
Both the Heikin Ashi and traditional Japanese candlesticks are made using open, close, high, and low prices, but what remains the difference is their motive use by the traders.
Traders use traditional candlesticks to predict the next movement of the chart, the HA candles are used to smooth out the noise from the chart with average price formations.
Traditional patterns involve a noise with green and red candles which gets hard to determine the exact trend of the market. In Heikin Ashi the chart displays consecutive candles with proper colours that helps traders to find the uptrend and downtrend easily.
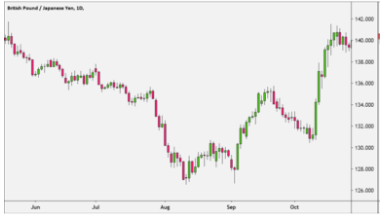
The above chart displays a traditional candlestick chart with noise and uncertain delivery of the trends in the market. However, the chart below depicts a clear price action of red and green candles depicting the downtrend and uptrend of security.
As you can see below figure that these candlesticks start their formation from the middle of the previous candle. It always starts from the middle level because it is calculated and determined from the formula. This is different from a traditional candlestick chart pattern.
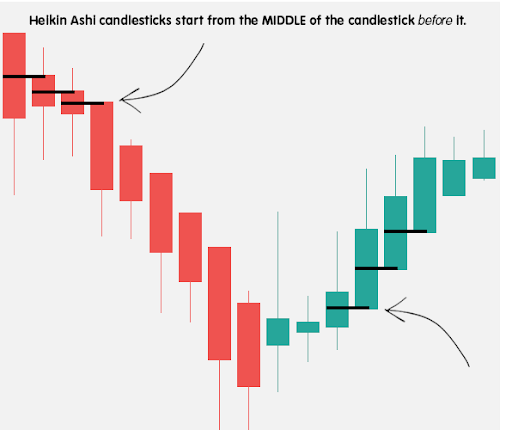
Thus, Heikin Ashi is useful, important and a clearer version of what traditional candlesticks have to offer.
Summary
Hope you find this blog of value that brings the basics of using and understanding the Heikin Ashi candlestick pattern. Traders find it hard to remember every aspect of technical analysis, therefore we are giving you a recap of what you just learned from this blog.
-
Heikin Ashi removes the noise from the chart and simplifies it for traders to capture the trend of the market.
-
Heikin Ashi chart displays consecutive green candles and red candles to spot the downtrend and uptrend of security.
-
Open Price = (Open + Close (Previous Bars)) / 2
-
Close Price = Open + Close+ High+ Low (Current Bar) / 4
-
High Price = Highest value of the current period
-
Low Price = Lowest value of the current period
-
Red candles with no upper wick indicate a downtrend
-
Green candles with no lower wick indicate an uptrend