A multiple-time frame analysis involves viewing the same security in different time frames.
Suppose you are using a 1-hour time frame to analyse your trading strategy, but you will be in constant doubt about the other time frames – weekly, 3-hour, 1-day, and more.
A time frame in trading is a period of time with seconds, minutes, days, hours, weeks, days, months etc. In technical analysis, the charts are observed in multiple time frames to observe the accurate entry and exit points.
Traders use longer timeframes to establish a longer-term trend and shorter frames for spot entries in the market. Although, there are several doubts about the time-frame charts which we are going to cover in this blog.
1. What are Multiple Timeframes?
Multiple timeframes are used to establish a trend from the market which produces ideal entries for the trader into the market. Traders should analyse multi-time frames before taking any trade as it helps in reducing the loss with cautious trading.
Let’s read further to understand which time frame is best for trading.
It is your responsibility to analyse through different time frames to receive actionable and identifiable trades in the market. Trading experience for a 15-minute chart, 1-hour chart to 3-day chart is beneficial to conduct intraday trading. Using multiple timeframe analysis as per your suitability can help you trade with high frequency.
The idea behind multiple time frame for intraday is that it holds reliable signals for a trader and reducing the time frame might give false signals of trading. Ideally, traders use any time frame as per preference and add a faster time frame to identify a reliable trend.

2. How to use Multiple Timeframes?
Multiple Timeframe is a type of analysis that helps traders to view multiple timeframes on a single security chart. For example, if you’re analysing BANK NIFTY’s 15-minute chart, you can also add a daily moving average or weekly Bollinger bands. In this manner, now you are analysing three different time frames on a single chart.
Nevertheless, how do we use multiple timeframes on a single chart?
Let us tell you in a simplified manner. . .
Use these 3 measures before using multiple timeframes:
-
Identification of Signal Charts
-
Addition of Higher Time Frame Chart in comparison to Signal Chart
-
Remember to trade in the Signal chart with the direction of the swings of the higher time frame chart
The above three are entry principles for using multiple timeframes. Generally, swing traders use daily charts as their signal charts whereas, a day-trader should use smaller-timeframe charts such as the 2/5/10/15/30 minutes chart. A positional trader mostly focuses on the weekly charts to identify the primary entry and exit points.
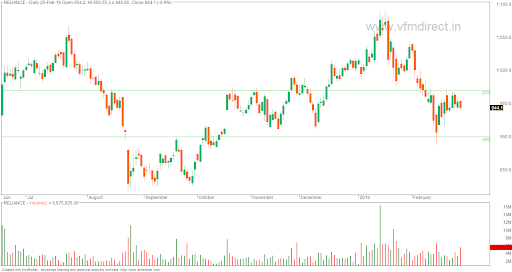
Let’s take an example of Reliance in multiple time frame charts
-
Daily Chart
In the daily chart, the trend is down, it requires immediate support on certain levels, and it might be bullish if it sustains above the given price.
-
Monthly Chart
In the monthly chart, there is no sign of multiple time frames, and the stock is in a range bound since 2010 (as per the chart). The support and resistance can be identified with the longer time frame, but immediate support can be found through daily charts only.
3. 3D Charting
Traders mostly fail in predicting a trade because they only follow signals and rules without understanding multiple timeframes.
Now, that you know about time frames and how to use multiple timeframes for trading, it is time for you to understand 3-dimensional or 3D Charting.
3.1 What is 3D Charting?
Three-dimensional charts are visually grasping and allow a trader to identify a trend, price and movement strategically with multiple timeframe analysis in a single chart. One doesn’t have to analyse different time frames at different charts.
A trader using 3D charts believes in the long-term performance of traders and the mindset of the trader is not to win or lose the trade. The mindset in 3D charting depends on the weekly or monthly performances of different traders.
3.2 How to trade in 3 Dimensions Charts?
To trade in 3 Dimension Charts, one should understand the type of trading to do using multiple time frames. The following basis will help you to trade through 3D charting.
3.3 Intraday Traders
As an Intraday Trader, suppose you focus on 5 minutes chart, 15 minutes chart and a 1-hour chart. Here, the 15-minute chart will help you find the centre of focus for the stock, the 60-minute chart will help you find the support and resistance levels whereas the 5-minute chart will determine the entry and exit points.
Trading using the 3 dimension and multi-frame chart can help the intraday trader to find the visible outcome during trading.
3.4 Positional Traders
A positional trader signal chart or main chart should be a daily chart in multi frames which produces the basic utility of trading. Further, you can take a weekly chart to assess the support and resistance with a 1-hour chart to determine the entry and exit points.
Swing or positional traders can use this setup to prepare a trading setup for their stock’s vision.
3.5 Investors
Investors should use weekly, monthly and daily charts as multi frames for investing their long-term earnings. The focus should be on the weekly chart, but the trader can include monthly and daily for support/resistance and buy/sell levels.
Thus, 3D charting is used to trade with an aspect of three-dimension charts that brings the multi-frame timings for the same stock or index.
We have explained the three dimensions in the case of positional, intraday and investors which are crucial for you to use while trading or investing.
EXAMPLE:
The 3D charting is presented while entering a trader where we have focused on
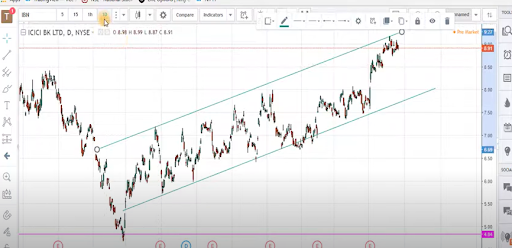
3.5.1 Daily Chart
As you can see the figure, the daily chart marks the trend lines for the stock. But it is still questionable for entry and exit levels or support and resistance, so we will change it to weekly chart for a longer frame.
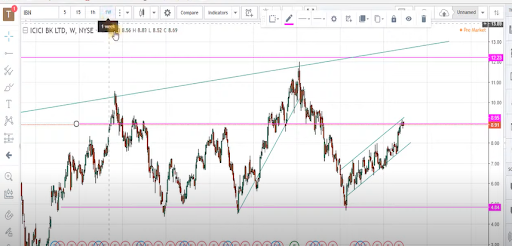
3.5.2 Weekly Chart
In the weekly chart, you can observe that we have drawn support and resistance levels on a longer-time frame basis. This helps us in observing the buying and selling zone. But the question is where do we make the entry?
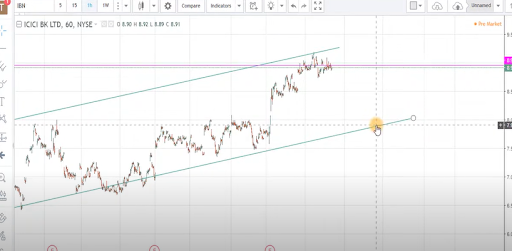
3.5.3 Hourly Chart
For deciding the entry and exit points we have come to the shortest time frame for this situation which is an hourly chart where we will watch the highest and lowest points within the trend line.
The stock is at the resistance level of the trendline which makes traders cautious about a possible reversal to a bearish movement. Therefore, we will wait until it comes back to the support zone to make an entry into the stock.
We hope that the example helped you in understand the importance and manner of trading with multi-time frame and three-dimensional chart trading.
&bnsp;

Key Takeaways
-
Using multiple timeframes helps traders to enter into a reliable trade
-
Use 3 measures before using multiple time frames – 1. Signal chart 2. Higher time frame chart 3. Trade through signal chart and identify the movement in higher time frame chart
-
A single chart cannot fulfill all the requirements of a trader
-
Multidimensional chart can help in analysing signals, support/resistance and entry/exit points at the same time
-
Investors uses daily, monthly and hourly chart
-
Positional traders use daily, weekly and hourly chart
-
Intra-day traders use 5 minutes, 15 minutes and 1 hour chart.