The gold-copper ratio climbed to an astonishing 830 in early 2026, causing considerable intrigue among investors and economists. The gold-copper ratio is usually passed over and more traditional metrics like GDP and unemployment are relied on, but splitting these metrics can give us an early warning of danger to the global economy. The gold-copper ratio signaled the danger, but what was the danger?
Looking into the gold-copper ratio 2026 to determine potential future warning signals, and examining what is available to determine future potential danger and looking into the history of the gold-copper ratio are my goals in this particular analysis.
What Does The Gold-Copper Ratio Tell Us?
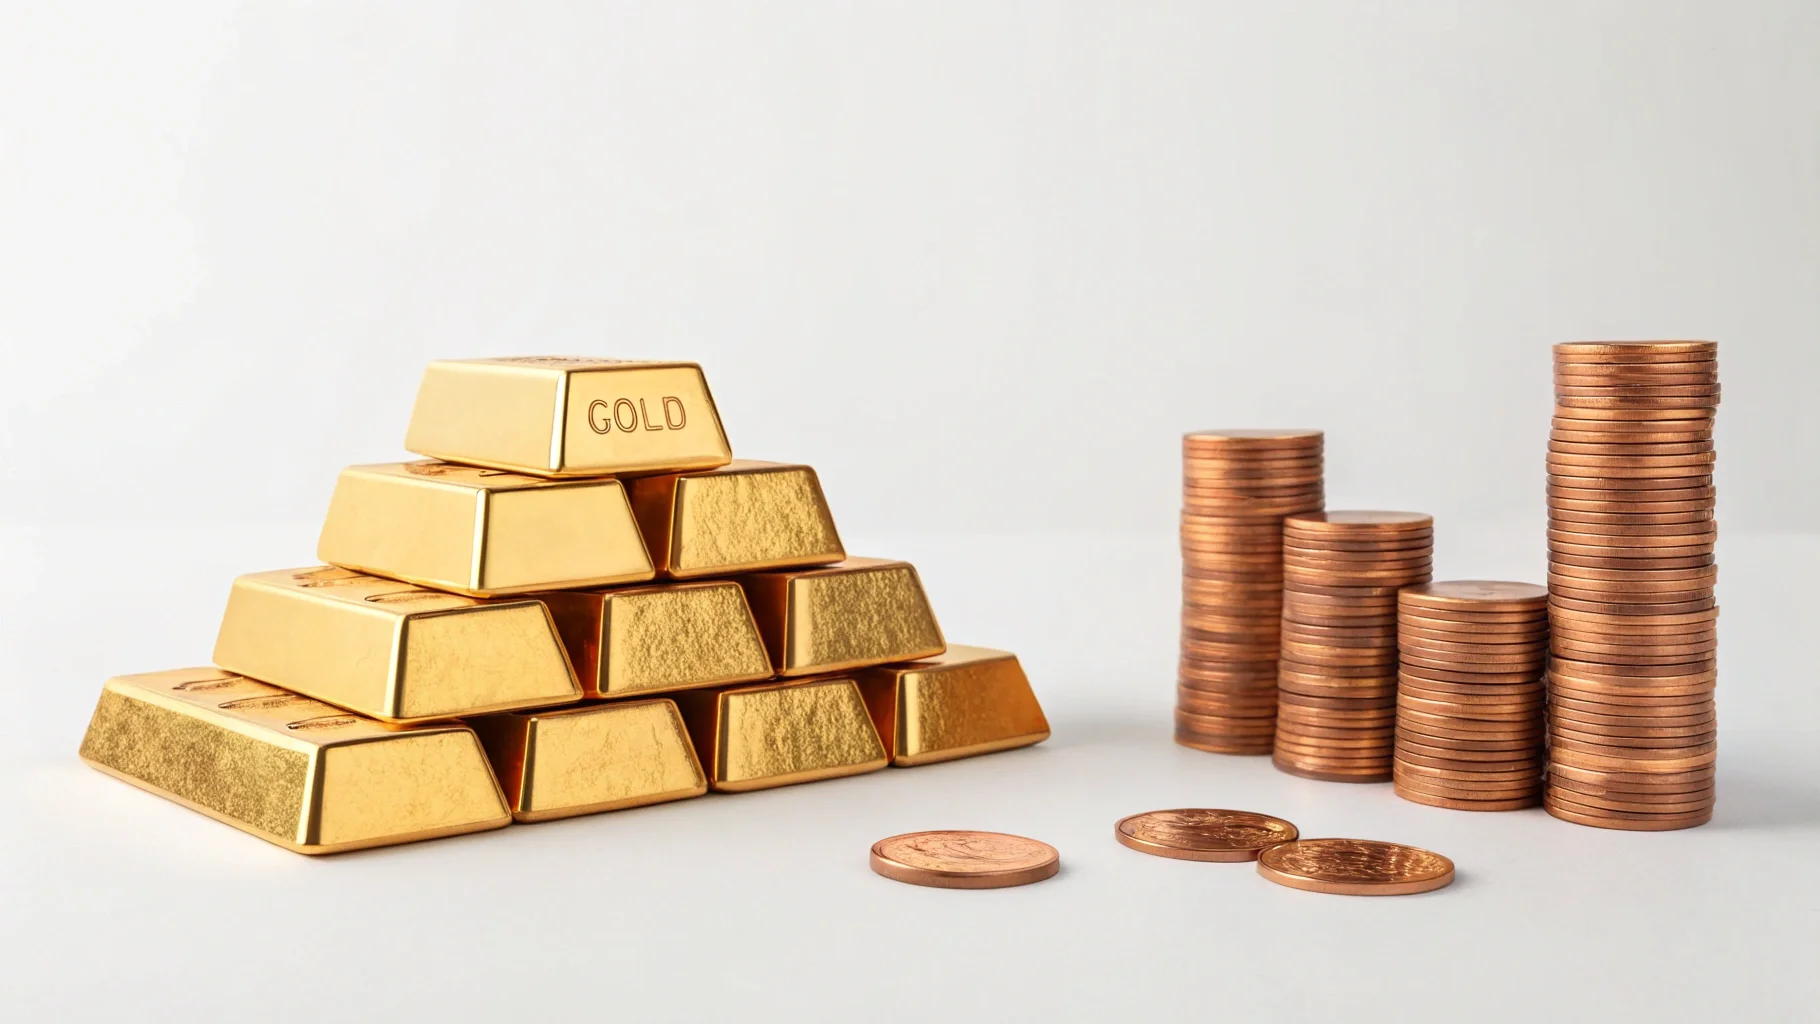
The gold-copper ratio is simply gold's price per ounce divided by copper's price per pound. In simple terms, this is an extremely powerful measure of economic sentiment and investors' beliefs about the economic conditions and possibilities.
Gold is often seen as a safe-haven asset, as the price tends to increase during uncertain times, fears of inflation, or geopolitical tensions. There’s also the industrial metal, copper, which is often referred to as “Dr. Copper” as it plays a role in construction, electronics, and infrastructure. Its price in demand also increases with economic growth and falls during an economic slowdown.

A gold-copper ratio that is lower than 400-500 suggests that there is strong industrial activity. Copper is outperforming gold which is a good economic indicator. On the other hand, a ratio as high as the current 830 is bad because it suggests that gold is performing well as a hedge, but copper is lagging in demand.
This is an example of having a gold-copper ratio as a leading indicator of the ice and stock markets, bond markets, and the economic cycle.
Historical Context of the Gold-Copper Ratio
The gold-copper ratiois reliable over decades. In the 2008 financial crisis, when there was a collapse in industrial demand, there was also an increase in the gold-copper ratioas investors were flooding into gold. In 2020, the COVID-19 pandemic was an example of lockdowns reducing copper usage while gold hit record highs. Overall, there have also been ratios that have characterised recessions over the decades.
The ratios 700-800 are what have also been seen in substantial recessions and/or market corrections.
In the 1980s, for example, gold and copper ratios reached high levels concerning gold. This was also the time of stagflation and high inflation.
- Gold prices remain high but unchecked as central banks buy up gold, compounded by inflation risk and geopolitical tensions. Meanwhile, copper prices are low, although they, too, reflect the lower industrial demand, global supply chain adjustments, and slower growth in China and the Eurozone.
In the spring of 2026, the price of copper will be approximately $5.90-6.00 per pound owing to these combined global factors. Gold might remain over $5,000 due to the aforementioned central banks and tensions. Finally, a developing copper/gold ratio will be measured at 830. This is the highest ratio the industry has seen in 45 years. 830 is high, but the over 000 value is associated with industrial disruption and stress. 830 is low as 224.
- In a nutshell, the greater the stress in a global economy, the greater the ratio value.
- Gold-copper ratios reflect pressures combined with the gold price and stressed industrial demand.
- In a nutshell, rising tensions and stress are the main drivers of a ratio value that currently measures 830.
Why the Gold-Copper Ratio Stands Out Among Market Signals
The gold-copper ratio stands out as a gold-copper ratio signal due to its distinct construction of two antagonistic elements:
- Risk-on (copper) vs. risk-off (gold).
- It is more nimble when it comes to economic data, frequently leading traditional metrics by multiple months.
The increasing gold-copper ratio (gold outperforming copper) often points to:
- Declined activities related to the industry.
- Risks of a recession.
- Elevated volatility of the markets.
- Investors are compressing bond yields due to safety concerns.
The ratio's advance to 830 is in lockstep with other warning signs like an inverted yield curve, PMI data that is getting worse, and problematic geopolitics. This is what makes the gold copper ratio 2026 so intriguing.

What the Gold-Copper Ratio Market Means for 2026
The gold copper ratio market for 2026 has multiple possible outcomes:
- If the ratio is still high or even higher at that point, we will likely see the same or worse on cyclical stocks (like industrials and materials) and more pronounced defensives (like utilities and healthcare).
- If the ratio is lower, it would likely mean we are on the other side of the economic fault line, and copper and dependent equities would experience a lift.
The things to monitor will be:
- Central bank operations: Rate cuts would likely be supportive to the gold leg, but if growth were to improve, it would also likely lift copper.
China's stimulus: Given that China is the biggest consumer of copper in the world, any policy changes might affect the ratio.
Geopolitical Events: Escalation tends to push the ratio higher.
In portfolio strategy, a higher gold copper ratiosupports investments in gold ETFs, gold mining equities, or investment grade bonds. Should the ratio peak, investments in copper may become attractive.
Strategy of Investment in Gold Copper Ratio
With the gold-copper ratio analysis, what can investors do?
Hedging: When the ratio exceeds 700, increase gold exposure (physical, ETFs like GLD).
Opportunistic buys: When the ratio is at the extremes, look at copper miners or ETFs (e.g., COPX) expecting a rebound.
Diversification: Offset exposure with broad indices, but go long defensives.
Monitoring: The ratio should be monitored weekly in conjunction with the ISM Manufacturing Index or Treasury yields.
While the gold copper ratio is not infallible, it is a reliable gauge of sentiment.

Conclusion
In 2026, the gold copper ratio at 830 is more than a number; it is a gold copper ratio signalindicating shifting patterns in the market. With gold performing as a safe haven and copper underperforming due to the headwinds in the industrial space, the signal is telling issuers to be cautious.
Risk adjustment, focus on staying power, and vigilance for reversals are key for investors in times like these. The markets may act irrationally for long periods, but evidence suggests that a high gold-to-copper ratio means that losses are coming.
It is possible to improve your confidence in how you navigate volatility by understanding and tracking gold copper ratio 2026 projections. Diversification, staying updated, and understanding timeless economic measurements are essential.

DISCLAIMER: This blog is NOT any buy or sell recommendation. No investment or trading advice is given. The content is purely for educational and information purposes only. Always consult your eligible financial advisor for investment-related decisions.