
One thing you have to understand when getting started with technical analysis is the meaning and purpose of each instrument. One of the most popular technical analysis instruments is the Fibonacci retracement tool. Whether it's forex, stocks, crypto or commodities, the proper use of Fibonacci levels can yield perfect trading entries and help you determine market psychology, identify value levels, and pinpoint trend reversals.
Why does Fibonacci work and how do professional traders use this instrument as a retracement strategy?
This guide will help you understand how to do Fibonacci trading with ease, whether you are a novice or a professional trader.
What are Fibonacci Retracements?
The Fibonacci retracement tool is a technical analysis market tool applied to identify how far the price of an asset will retrace when exhibiting a trend and minimise the risk of losing money. The retracements are based on the Fibonacci sequence, a formula discovered by the Italian mathematician, Leonardo Fibonacci.
The tool is designed to show specific intervals at which a trader can expect the price of the instrument to react and calculate possible levels of price pullbacks and fluctuations.
The levels or ratios are:
- - 23.6%
- - 38.2%
- - 50% (not an official Fibonacci level but a commonly used figure)
- - 61.8% (Golden Ratio)
- - 78.6%
These levels are considered pullback levels in which the price of the instrument will retrace and react.

Why Does Fibonacci Work in Trading?
Fibonacci Retracement works because no movement in the market is linear: everything goes in waves along the line of an established trend. After every impulsive movement in price, it is likely to pull back to a specific ratio of Fibonacci levels before going back to the trend.
Market psychology Fibonacci ratios:
First reason: Traders turn to the same levels, creating a latent given level of the ratio.
Second reason: Obligated to formulate latent levels of support + resistance.
Predicts empty zones: Out of guesswork, Fibonacci is explicit in providing a level to wait at.
Encompasses all time zones:
- - perform scalping
- - perform swing trading
- - perform long term investing
- - perform trading of all cryptocurrencies [NFTs included].
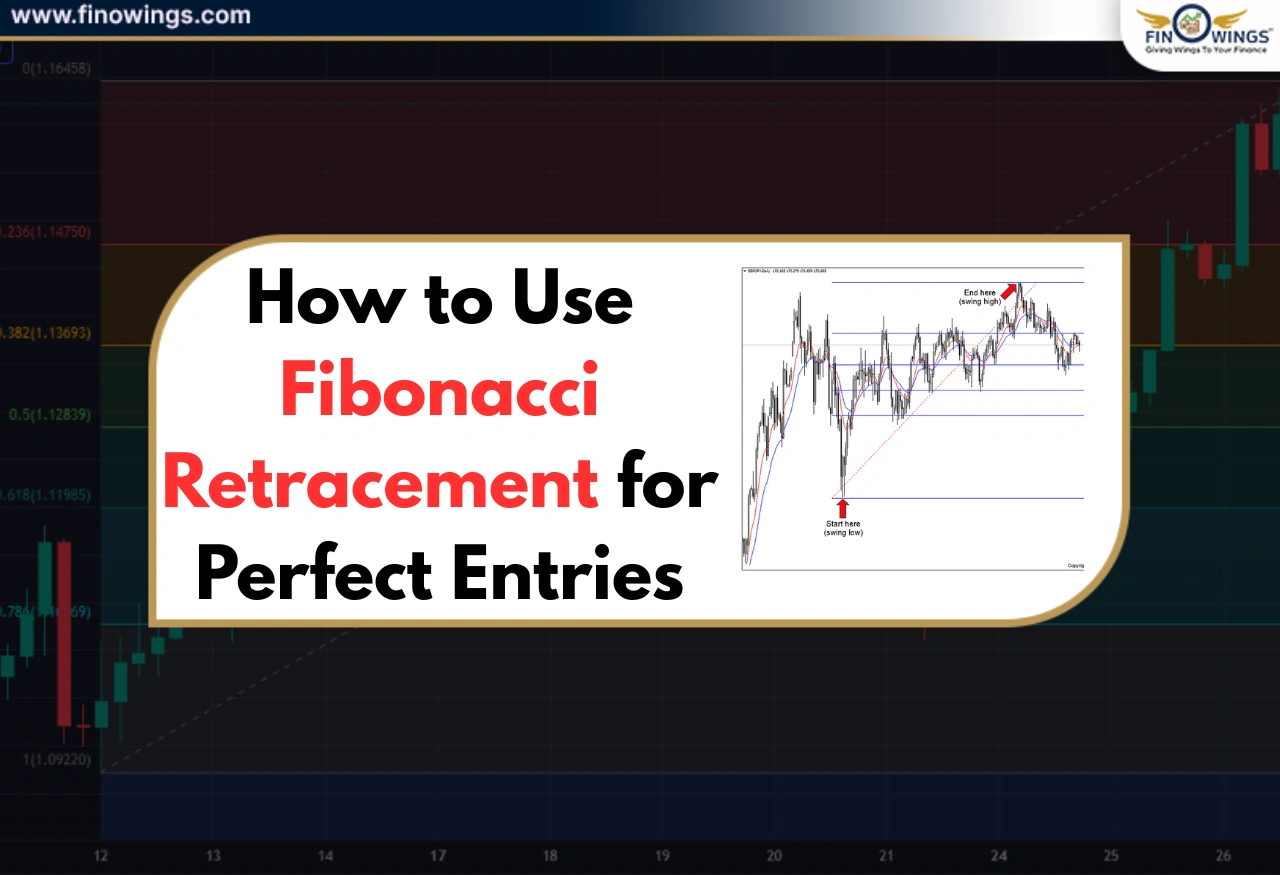
How to Draw the Fibonacci Retracement
Fibonacci trading is a bit like a guessing game. A bit of trading intuition is implied, though. It's the placement that's the most important.
For uptrend:
1. Identify swing low.
2. Move the pointer to the swing high.
3. Levels will appear under the high point.
In an uptrend, Fibonacci will help you find buy entries at retracement levels.
For downtrend:
1. Identify swing high
2. Move the pointer to swing low
3. Levels will appear above the low point. Fibonacci helps as you look for sell entries, you are in a downtrend retracement level.
Meaning of Each Fibonacci Level (Which One to Trust?)
Let's break down how each behaves:
23.6% - Shallow Pullback
- Seen in very strong trends.
- Only aggressive entries are suitable.
38.2% - Ideal Pullback in Strong Trends
- Seen the most in trending markets.
- This level is the most reliable.
50% - Mid-Level Reversal Zone
- This level is not Fibonacci, but it is very powerful.
- The price often reacts, but continues the trend.
61.8% - The Golden Ratio
- The most important level in Fibonacci Retracement.
- This level has a perfect balance between deep pullback and trend continuation.
- If you are a swing trader, this is a high-probability entry.
78.6% - Deep Pullback / Final Defence
- This level is used when the market briefly breaks a key level and then reverses.
- This level is also useful for stop-hunt situations.
The Perfect Fibonacci Retracement Strategy (Step-by-Step)
This powerful retracement strategy is simple.
STEP 1: Identify the Trend
Fibonacci should never be used in a sideways or choppy market.
Strong uptrend = entry long positions
Strong downtrend = entry short positions. Try using the following tools:
- Moving Average (20/50/200).
- Trendlines.
- Market structure (HH, HL, LH, LL).
STEP 2: Draw your Fibonacci from Swing to Swing
Choose the correct swings:
- If you want to initiate a buy, go from low to high.
- If you want to initiate a sell, sell high to low.
STEP 3: Be Patient and Allow for the Price to Retrace
- Do not enter the position right away.
- When the price returns to key Fibonacci levels, 38.2%, 50%, and 61.8% (Golden Zone) are among the top entry levels.
- The region of 38.2% to 61.8% is often referred to as the golden pocket, meaning it's the highest probability zone for a price reversal.
STEP 4: Confirm using Support and Resistance
Fibonacci becomes even more powerful when used in conjunction with other indicators.
What to Search for:
- Prior levels of Support/Resistance.
- Touch and Bounce of a Trendline.
- Bounce off an Exponential Moving Average (EMA).
- Candlestick reversal pattern (Think Doji, Pin Bar, Engulfing).
- When Fibonacci levels and Support/Resistance levels overlap, it's the strongest entry point.
STEP 5: Entering Trades
Once you are confirmed:
Entering BUY Trades:
- Look for an entry point in the 38.2%-61.8% retracement.
- Stop losses should be below the 78.6% level.
- Entering SELL Trades:
- Entering points should also happen in the 38.2%–61.8% retracement.
- Stop losses should be set above the 78.6% level.
STEP 6: Using Fibonacci Extensions to Set Take-Profit Levels
To determine profit targets:
TP1:0% level
TP2:127.2% extension
TP3:161.8% extension
These points are natural projection zones, which is where the price will reverse.
An Example of the Perfect Fibonacci Trading Entry
Imagine a stock price going up from ₹100 to ₹150.
When using Fibonacci to chart:
38.2% = ₹131
50% = ₹125
61.8% = ₹119
Once the price retraced to ₹125, it created a bullish engulfing candle and bounced back.
This creates an ideal Fibonacci Retracement entry, due to:
- Direction of the trend.
- Key Fibonacci level.
- Price action confirmed.
- Therefore, your profit will be in the range of ₹150, ₹160, and ₹168.
Retracement Fibonacci Trading Mistakes
To fully learn Fibonacci, remember the following:
Drawing Fibonacci for the wrong swings.
Always use major swing points, and avoid micro-swings.
Using Fibonacci in markets going sideways.
Fibonacci only works in trending markets.
Entering without confirmation.
Decrease the reliance on Fibonacci. It is only a guide and should not be depended on.
Expecting exact reactions
Consider levels to be zones, not to be exact prices.
Overloading the chart with indicators
Don't overwhelm your chart with indicators.
Advanced Techniques of Fibonacci Trading
If you want to trade like a pro, you must combine Fibonacci with:
A. Fibonacci + Trendlines
Fibonacci and trendline support create strong price reactions.
B. Fibonacci + Moving Averages (EMA 50 / EMA 200)
Perfect entries come from EMA bounces near 38.2% or 50%.
C. Fibonacci Cluster Zones
Using multiple swings helps find overlapping Fibonacci levels. Strong reversal zones are created from clusters.
D. Fibonacci with RSI Divergence
If you see price hit 61.8% and RSI forms divergence, it's a strong reversal setup.
Why Are Fibonacci Retracements Game Changers for Traders
- Gives accurate entry zones.
- Helps time the market.
- Offers clear invalidation (your stop loss).
- Applies across all markets.
- Provides structure to your trading plan.
- Removes emotional decision making.
- Most traders fail because they buy either too early or too late.
- With Fibonacci Retracements, you're clearly shown where to wait.
Conclusion
Fibonacci Retracement is one of the most helpful tools in technical analysis, allowing traders to understand the market structure, find correct trading entries, and predict reversals. Using Fibonacci levels like 38.2%, 50% and 61.8% allows traders to execute a disciplined retracement strategy, which in turn increases profit and decreases trading based on emotions. Trading Fibonacci levels with support and resistance and price action fusion is beneficial and increases your rate of success when trading stocks, forex, crypto or indices.

This guide explained how to draw Fibonacci correctly, how to use it with trending markets, and how to integrate it with more advanced skills for more precise entries. Fibonacci Retracement, if used consistently, will change your attitude towards Fibonacci trading and assist you in trading with more confidence and with a plan. Always remember, Fibonacci is a valuable tool, but only when used with confirmation, not in a vacuum. One of the most profitable skills in trading will be unlocked for you if you practice this, backtest it, and refine your strategy.
DISCLAIMER: This blog is NOT any buy or sell recommendation. No investment or trading advice is given. The content is purely for educational and information purposes only. Always consult your eligible financial advisor for investment-related decisions.


