It is your practical starting point. Before investing in a new IPO, compare the company's key financial ratios—like P/E, ROE, debt-to-equity, and profit margins—with similar listed peers in the same industry.
This quick IPO peer comparison helps you spot if the new company is fairly priced, growing well, or carrying hidden risks. It turns guesswork into smarter decisions without needing to be a finance expert.
Imagine this: You're at a big family wedding. Everyone is excited about the new couple, full of hopes and dreams. But wise Uncle Raj pulls you aside and says, "Beta, don't just look at the fancy clothes and lights.
Check if they have a solid plan for the future, like a good job, savings, and no heavy loans." That's exactly what IPO Peer Comparison does for you as an investor.
When a company launches its Initial Public Offering (IPO), it's like stepping into the spotlight. Everyone wants a piece of the excitement. But smart beginners don't jump in just because of hype.
They use simple tools like IPO Financial Ratios to understand the real story behind the numbers. This IPO Analysis Guide will walk you through it in easy steps, with real examples, a clear data table, and tips you can use right away.
Before comparing financial ratios, it is important to understand how they are calculated and what they actually indicate. To learn more about P/E, ROE, EBITDA margin, and cash-flow ratios, read our guide on IPO Financial Metrics Explained.

Why IPO Peer Comparison Matters for Beginners
Think of buying shares like choosing a team mate for a long cricket match. You want someone strong, reliable, and not too expensive. Peer comparison IPO does this by lining up the new IPO company against others already playing in the same league (industry).
For example, if a new food delivery company comes to market, compare it to Zomato. If it's in beauty e-commerce, look at Nykaa. This industry benchmarking IPO shows whether the new player is better, average, or risky. It helps avoid overpaying (expensive valuation) or missing red flags like too much debt.
Without this, you might fall for stories and miss the facts. With it, you invest with confidence.
Financial ratios show the fundamental strength of a company, while grey market activity may offer an informal indication of investor sentiment before listing. To understand its limitations and risks, read Grey Market Demand in IPO.
Key IPO Financial Ratios Every Investor Should Check
Here are the most important IPO Financial Ratios explained in simple words. Focus on these for IPO Valuation Analysis:
1. Price-to-Earnings (P/E) Ratio: How much are you paying for every ₹1 of the company's profit? Lower is often better if growth is similar, but high-growth companies can have higher P/E. Compare with peers.
2. Price-to-Book (P/B) Ratio: Compares share price to the company's net assets (book value). Useful for asset-heavy businesses.
3. Debt-to-Equity (D/E) Ratio: Shows how much the company borrows versus owner money. Lower is safer—less risk of trouble if business slows.
4. Return on Equity (ROE): How well the company uses your money to make profits. Higher is better.
5. Profit Margins (Gross and Net): How much profit remains after costs. Growing margins signal efficiency.
6. Current Ratio: Ability to pay short-term bills. Above 1 is generally good.
These ratios together give a full picture in your IPO Peer Review.
Storytelling Example: The Rise of Food Delivery and Beauty Tech
Remember when food delivery apps changed our lives during tough times? Companies like Zomato went public with huge promises but early losses. Investors who did a ratio comparison noticed improving margins and strong growth despite high valuation. Similarly, Nykaa brought beauty products online and grew fast.
Let's say a new quick-commerce IPO (like Zepto) enters the ring. By comparing its ratios to Zomato and Nykaa, you can see if it's more efficient or burning cash too fast. This real-world benchmarking turns confusing prospectuses into clear insights.
An IPO should not be considered cheap or expensive based only on its P/E ratio. To understand market capitalization, enterprise value, and peer valuation multiples in detail, read IPO Valuation Explained.
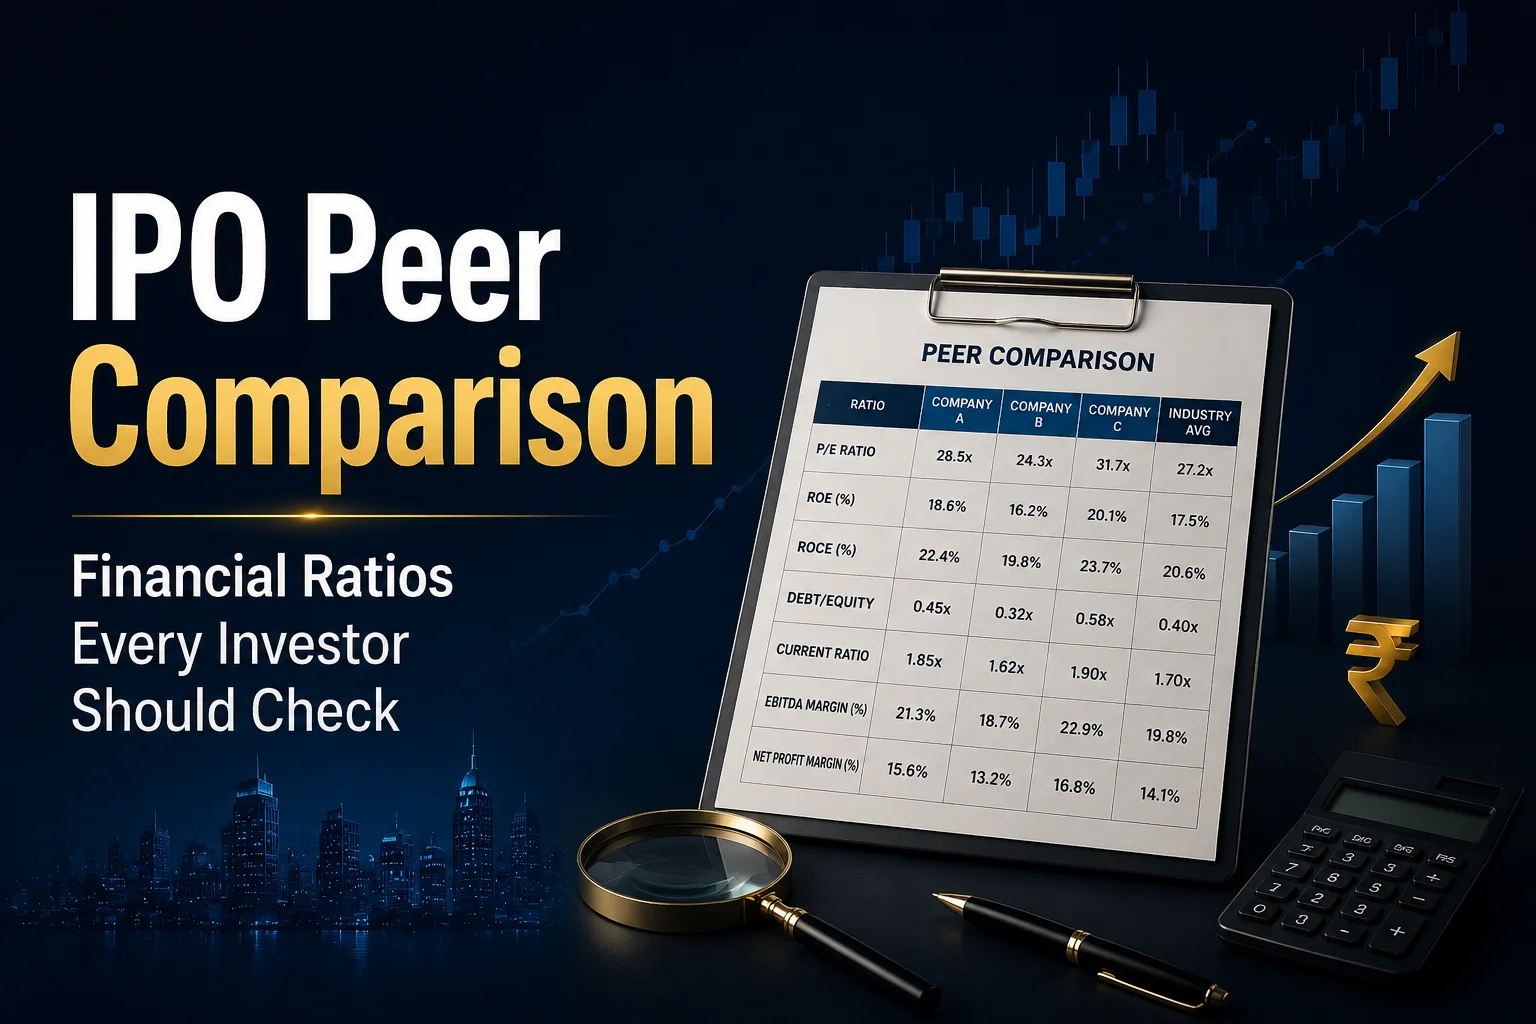
Sample IPO Peer Comparison Table
Here's a simplified example table for peer comparison IPO in the e-commerce/consumer tech space (approximate latest available figures for illustration; always check current data):
|
Company |
P/E Ratio |
P/B Ratio |
Debt-to-Equity |
ROE (%) |
Net Profit Margin (%) |
Current Ratio |
|
Zomato (Eternal) |
~336 |
~6 |
~0.0 |
~7 |
~0.7 |
~3.5 |
|
Nykaa |
~380 |
~50 |
Low |
~15 |
Negative to improving |
~2.0 |
|
Industry Avg (E-com) |
Varies |
Varies |
<0.5 |
10-20 |
5-15 |
>1.5 |
|
Hypothetical New IPO |
250 |
8 |
0.2 |
5 |
-2 |
2.8 |
Interpretation: The new IPO might look cheaper on P/E but has lower ROE and still losses—signals higher risk. Zomato shows better liquidity. Always dig deeper!
(Data sources: Public financial reports and market summaries. Verify latest from NSE/BSE or company filings.)
Along with peer valuation, it is also useful to track how much demand the IPO is receiving from different investor categories. You can check the latest retail, NII, and QIB demand through the IPO Subscription Status guide.
Step-by-Step IPO Analysis Guide Using Ratios
Step 1: Read the IPO Prospectus Basics
Look at revenue growth, profits/losses, and how they plan to use IPO money.
Step 2: Pick Peers
Find 3-5 similar listed companies in the same sector.
Step 3: Gather Ratios
Use free sites like Moneycontrol, Screener.in, or company investor pages.
Step 4: Compare and Benchmark
Ask: Is the IPO growing faster than peers? Is the valuation justified? Is debt manageable?
Step 5: Look at Trends
Check if ratios are improving over the years—not just one snapshot.
Step 6: Consider the Big Picture
Management quality, market size, competition, and risks. Ratios are tools, not the full story.
This IPO Analysis Guide makes the process beginner-friendly.
After submitting an IPO application, you may want to change the bid price, quantity, or withdraw the application. Learn the complete process in How to Modify or Cancel IPO Application.
Common Pitfalls to Avoid in IPO Valuation Analysis
-
Ignoring industry differences: Tech companies often have high P/E ratios due to growth.
-
Focusing only on one ratio: A low P/E with high debt is risky.
-
Chasing hype without peer comparison ipo.
-
Forgetting post-IPO performance: Many dip after listing.
Do industry benchmarking, IPO to stay grounded.
Receiving an IPO allotment is not the final step of the investment process. Before listing day, it is important to plan whether you will book profits, sell partially, or hold for the long term. Read IPO Listing Strategy to understand how to manage listing gains and volatility.
Real Benefits of Doing a Thorough IPO Peer Review
Investors who use this method often make better choices. They avoid overvalued IPOs and find gems with strong fundamentals. Over time, this builds wealth steadily. Plus, it feels empowering—like understanding the game instead of just watching.
While reading the prospectus, it is important to understand the lower and upper price band of the IPO because investors must place their bids within this range. To learn about cut-off price and bidding, read IPO Price Band Explained.

Conclusion
IPO Peer Comparison is not rocket science. It's like checking a new player's stats before betting on the match. By mastering IPO Financial Ratios, IPO Valuation Analysis, and IPO Peer Review, you turn excitement into educated bets. Start small, practice with one IPO, and build the habit.
Once your analysis is complete, you can apply for the IPO through a supported broker or investment app using a UPI mandate. For the full process, mandate approval steps, and common errors, read How to Apply IPO Using UPI.
(Sources: corporatefinanceinstitute.com , journals.sagepub.com , moneycontrol.com , nseachvies.nseindia.com , tradingview.com

DISCLAIMER: This blog is NOT any buy or sell recommendation. No investment or trading advice is given. The content is purely for educational and information purposes only. Always consult your eligible financial advisor for investment-related decisions.