Moving Average (MA) is an indicator to analyze the updated average price during technical analysis. It uses the latest price data points to find the direction of the trade.
A trader uses a moving average to find the price movement patterns of the securities and indices they are willing to enter for trading or investing.
A moving average indicator is a lagging technical indicator used to ascertain the direction of the trend. It is a trailing price action that takes place in the chart to find the potential movement in the stock.
A rising movement in the moving average indicates that the stock is an uptrend. Similarly, a declining trend in the stock with a moving average indicates a downtrend.
It is a simple technical analysis tool to recalculate the latest price data so you can understand the stock's price direction. It is calculated by summing up the security data points and dividing them by the total number of data points to arrive at the average point.
The moving average stock line also helps develop support and resistance indicators for the traders. The MA line is based on several previous closing prices that help in confirming the present trend.
In the stock market, the moving average with 50-day, 100-day, or 200-day acts as a support level determining the price trading above the support zone. Sooner, the moving average acts as a resistance when the price hits the support level and drops below.
A moving average includes a certain number of data points that derive the 50/100/200 moving average periods. The only difference between the periods is the use of different times in the calculation.
In 50DMA, the calculation is done using the past 50 data points later divided by 50 to get the result. Similarly, in 200DMA, the analysis is done using the past 200 days and dividing it by 200.
In the figures below, you can spot the 50DMA and 200DMA used in their respective days' moving averages.
Moving averages define the trend using the historical price averages, depending on the trader opting for 50-DMA, 100-DMA, or 200-DMA. These are the popular strategies for entry and exit of a security price.
A moving average is used in technical analysis to analyze where the stock is headed. This technique is essential for day traders and positional traders.

1.1 Types of Moving Average
Moving averages are different kings traders use to trade in the stock markets. In this blog, you will relate to four moving averages that every trader uses to identify the trend in the stock market.
Depending on the information, a trader will use the following moving averages per the suitability to trade and find direction.
Simple Moving Average (SMA)
A simple moving averages method or SMA is created by adding the most recent security data points and dividing them by the time. Traders use the SMA indicator to signal a security's price changes. This helps in ascertaining when to enter and when to exit the stock.
This moving average indicator is beneficial for traders to determine the buy and sell signals from the historical period data. On average, the traders can make decisions on its price movement for further benefits.
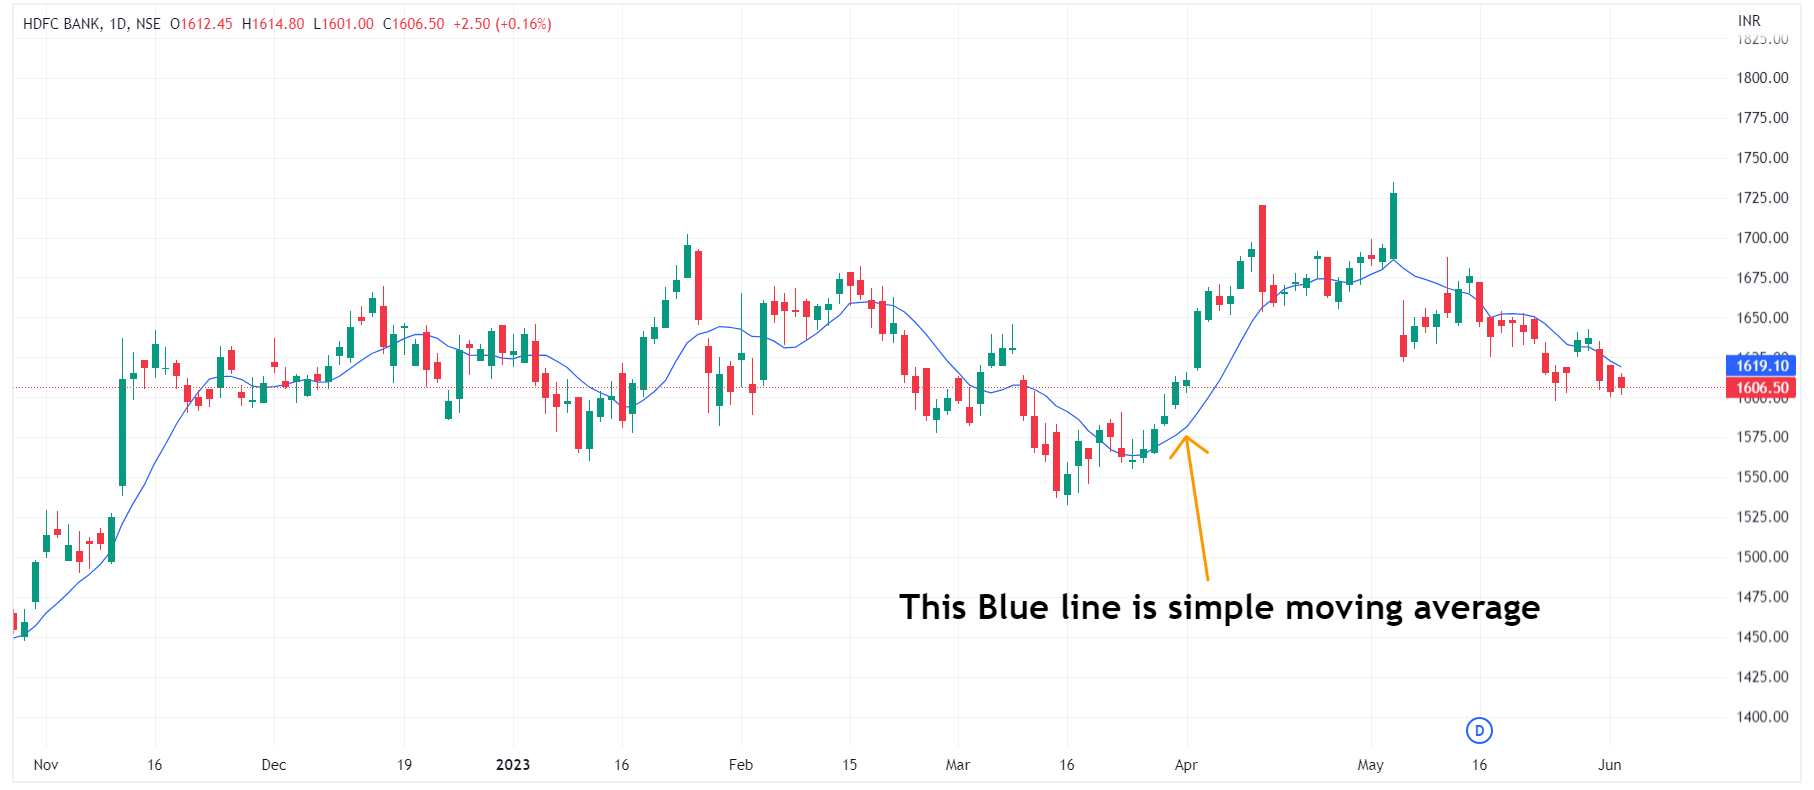
For example, a trader wants to calculate the SMA using the closing price of the last 3 days of a particular stock. Therefore, the simple moving average will be calculated as follows:
Suppose the closing price for the security for the last 3 days is, Rs. 50, Rs. 55, and Rs. 52
Therefore, the SMA will be calculated as,
SMA = (50+55+52) / 3
SMA= 52.33
The SMA will be shown in the chart using the moving average indicator to help traders plot their trades for the coming days.
Exponential Moving Average (EMA)
Traders should learn about what is exponential moving average in stock market. The exponential moving average is another type of moving average that finds the average through the most recent points which are most responsive. EMA assists the traders in analyzing the price changes in the security with the recent data points.
EMA specializes in identifying the signals based on crossovers and divergences from the historical averages. Traders can identify the buy and sell signals by several crossovers in the technical chart.
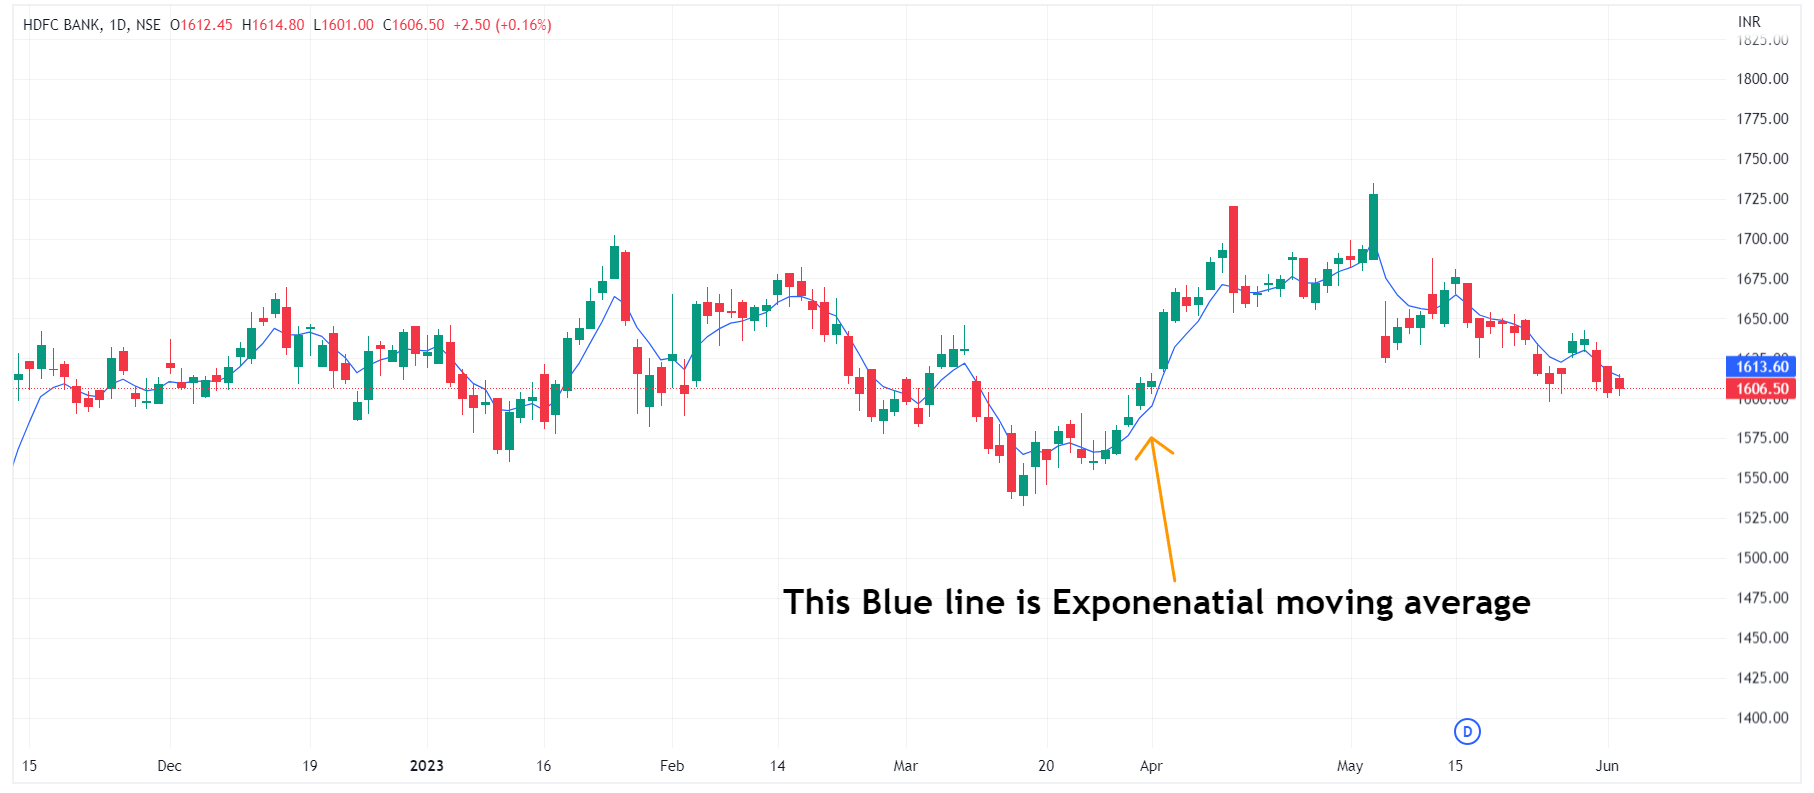
In this case, EMA lengths are 10-day, 50-day, and 200-day moving averages performed well for security analysis. Calculating SMA is straightforward; however, in EMA, one needs more observation and identification skills.
Suppose a trader wants to calculate EMA using a 20-day length, then the trader should wait for 20 days to obtain the SMA first. After 20 days are complete, the trader should use the SMA from the previous day as the first exponential moving average strategy for yesterday.
The formula for calculating the EMA
-
[2 ÷ (number of observations + 1)]
-
For 20 days, the EMA will be calculated as:
-
[2/ (20+1)] = 0.0952
A good exponential average can be developed using longer-day EMAs such as 100-DMA or 200-DMA. An EMA is more focused and accurate than an SMA, which is used to derive the direction of the price movement.
Weighted Moving Average (WMA)
Weighted moving average, or WMA, is used to generate the trading direction of the market or security. Based on this, the traders decide on buying and selling aspects.
Traders use weighted average moving averages because the calculation gives more weightage to the recent data points than historical data points.
The WMA is a technical indicator that calculates the data set using a predetermined weighing factor. For example, WMA is used, and if the security price is above the WMA line, it signals that the trend is going into an uptrend movement.
The following figure plots the WMA for the 9 periods to determine the weighted average price of the NIFTY 50 Index.
Double Exponential Moving Average (DEMA)
DEMA or Double exponential moving average refers to the advanced version of EMA that shows the double effect on understanding the security's price trend.
Double EMA is highly responsive for short-term traders as it spots the change in trend instantly. It is a measure to determine the trending average from a security's most recent weight from the price data.
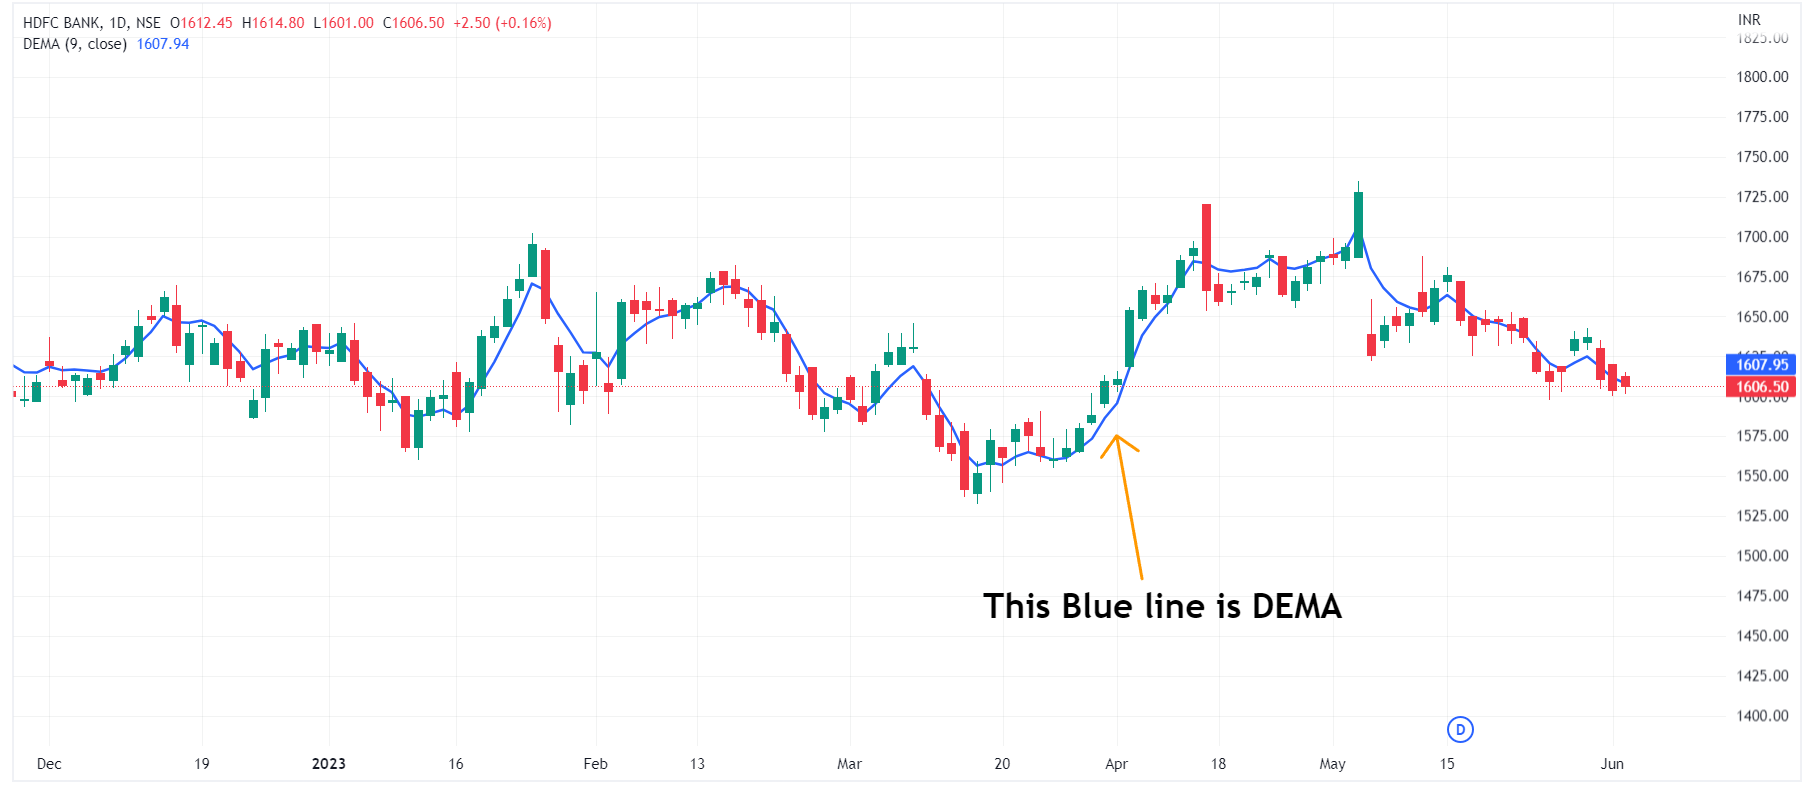
It is more powerful than the other indicators because it allocates more weight to the recent data points to derive the trend.
The below figure shows the EMA and DEMA lines to help traders understand the closest price points with the change in deviations.
What is MACD?
Moving Average Convergence: A momentum indicator displays the price movement of a security's moving average.
It is calculated by subtracting12 periods of EMA from 26 periods of EMA.
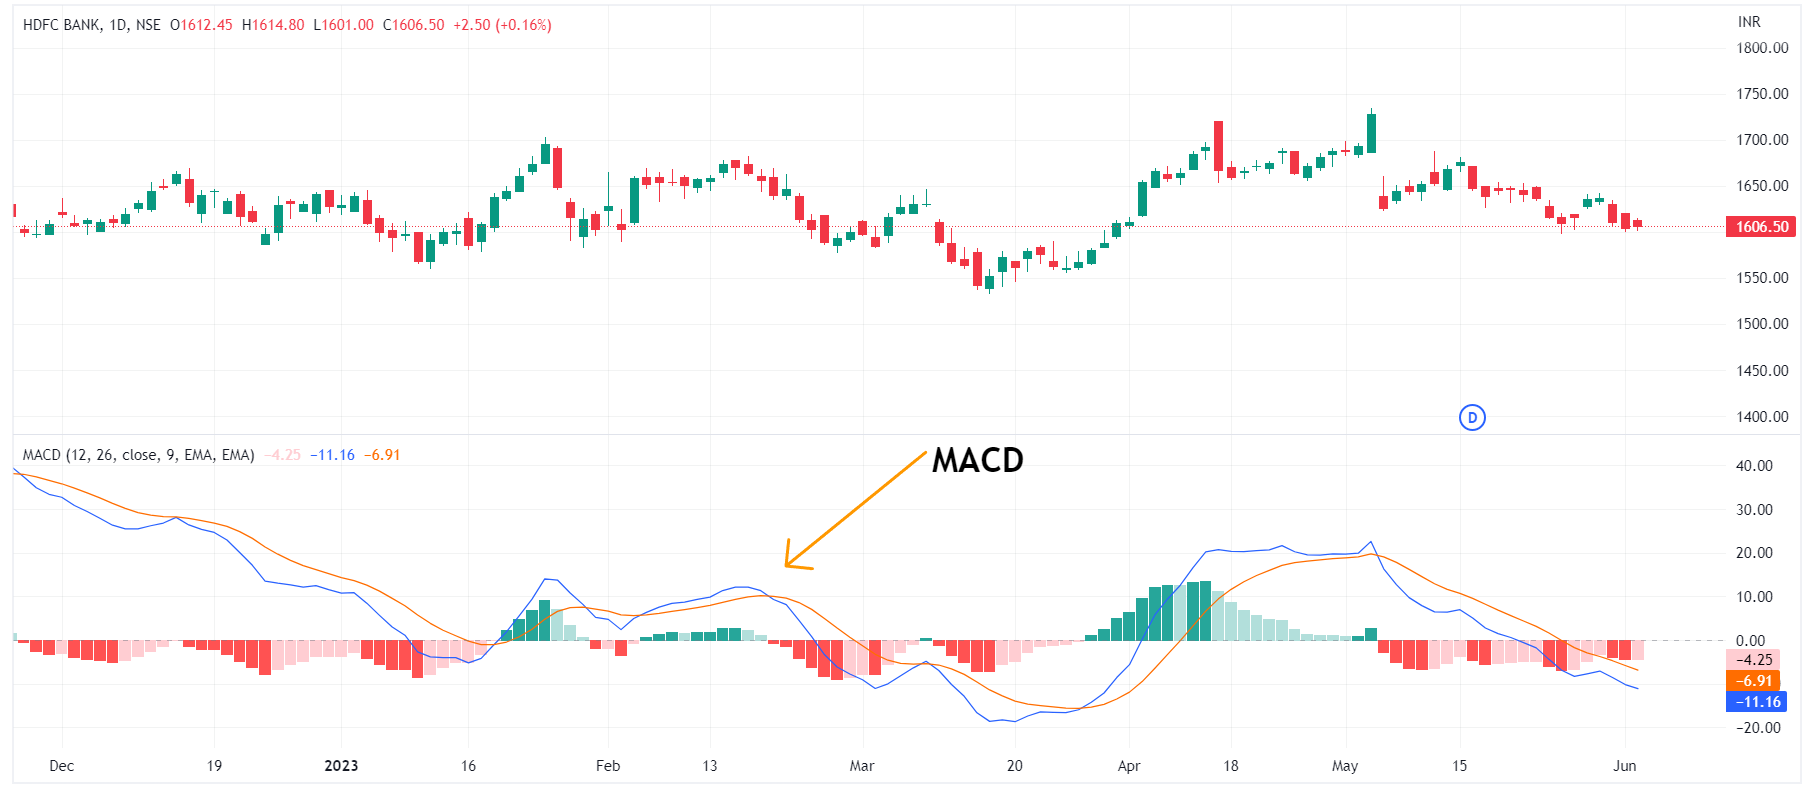
MACD indicator use can help traders to understand a security's bullish or bearish momentum. It is a popular moving average indicator that presents versatility when used during trading.
MACD is derived from the MACD line and Signal line, which helps assess the security price function. When MACD crosses above 0, it is a bullish movement, whereas when MACD crosses below 0, it is a bearish movement.

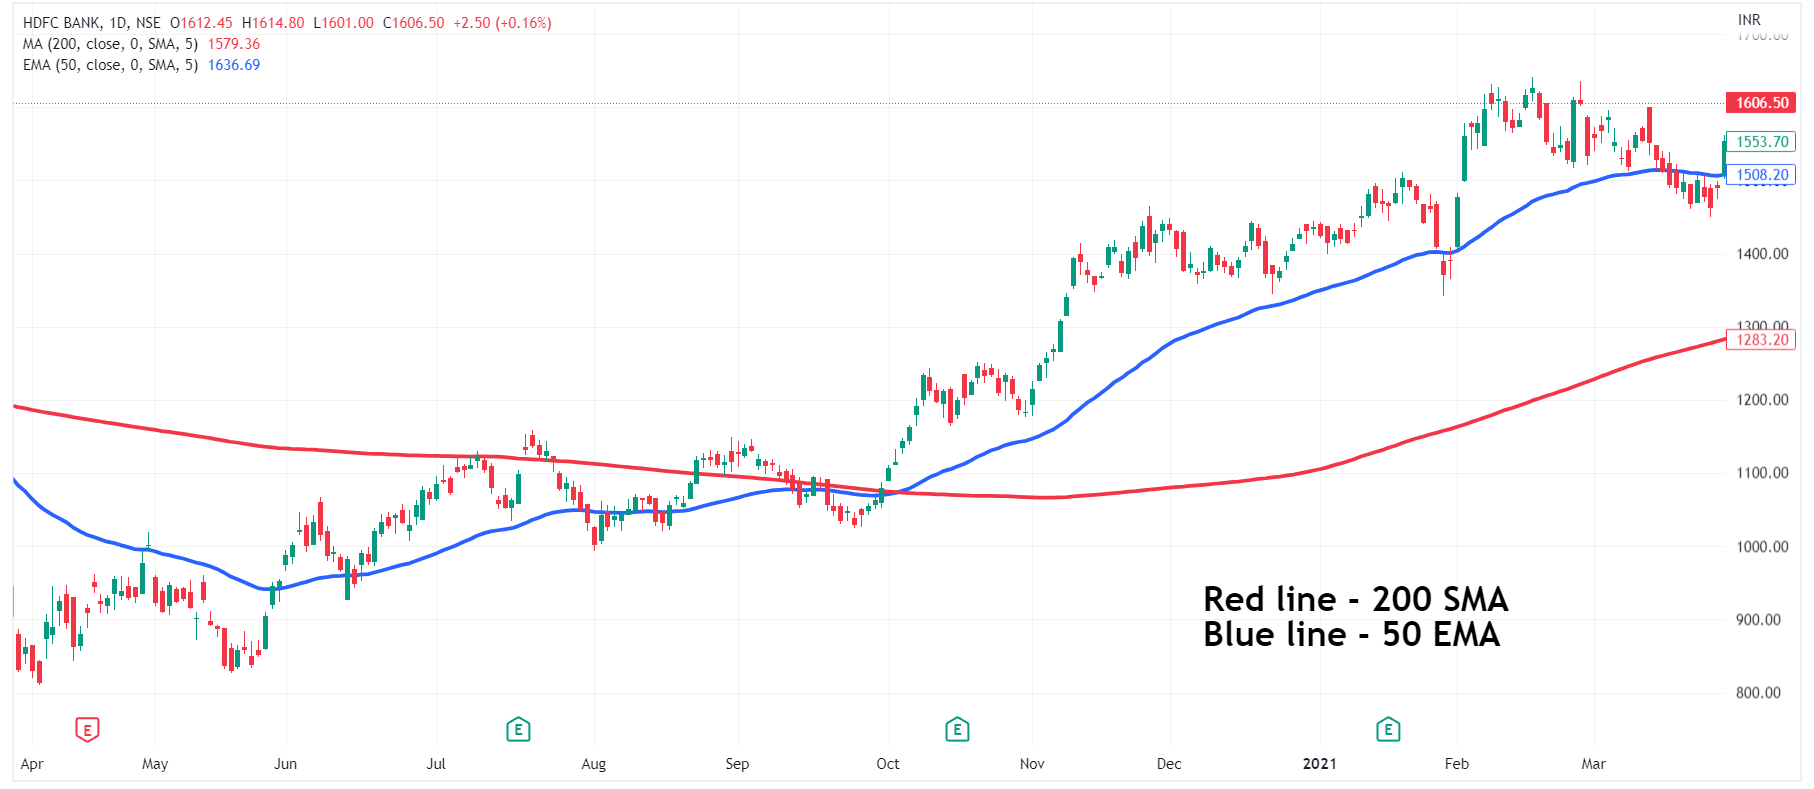
What is Golden Cross?
A golden cross occurs when the short-term moving average exceeds the long-term moving average and stays in an uptrend. In this case, the moving average values of50 EMA and 200 SMA are used to determine the crossover.
The golden crossover increases the trader's probability of equipping the trade as more opportunities are open with the golden cross strategies.
According to many experts, golden cross strategies are useful and profitable for crypto traders. Although, equity and options trades use it well through higher time frames to estimate the price and vision of the security.
Conclusion
Moving averages are mostly used to analyze the market trend or a particular company's stock. However, the types of technical indicators are used willingly by traders that help them explore their future position in the market.
Learn about the moving average types and crossovers to identify which works best.
Key Takeaways
-
Moving average is a lagging indicator
-
MA is calculated by the sum of all data points and diving it with the total number
-
Popular data points used in MA are 50DMA, 100DMA, and 200DMA
-
SMA is obtained by recent data sets and helps traders in ensuring when to enter or exit the trade
-
EMA priorities most recent price points and is more responsive
-
WMA gives more weight to current data than the past data points
-
DEMA helps short-term traders to spot trend reversals quickly
-
MACD is a momentum indicator that helps in identifying bullish and bearish movement
-
A golden cross is a crossover of 200DMA and 50DMA.