
In technical analysis, it is often the price action patterns that tell the story of the strength of buyers, the level of resistance buyers face, and the possible breakout of market movement. Of the price action patterns, the ascending triangle chart pattern (called the rising triangle pattern) is one of the most dependable formations that traders utilise when anticipating strong market movement.
It is especially adored by technical market participants as it depicts price accumulation, momentum, and possible ascending triangle breakout formations. This guide will elaborate on the ascending triangle pattern and its various attributes, such as its structure and meaning, ways to spot it, and actionable strategies that one can employ in order to maximise trading returns on the pattern.
Definition of Ascending Triangle Pattern
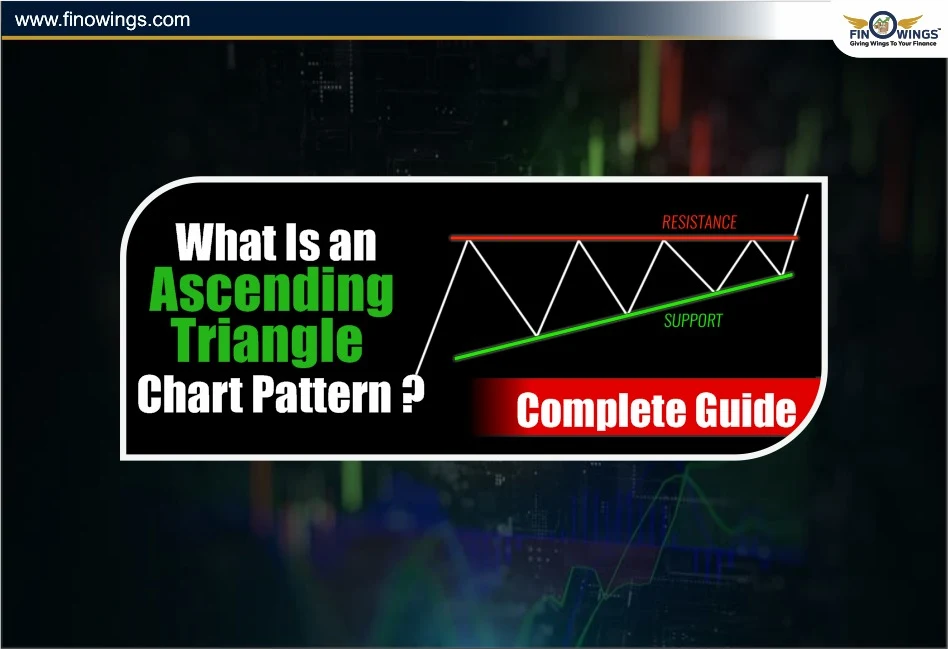
The ascending triangle pattern is one of the bullish continuation chart patterns, where the price pattern signals possible future breakout movement in the upward direction after a period of consolidation. An ascending triangle pattern is formed when the price of a stock/index is trading between a converging pair of trendlines, namely:
-
A horizontal resistance line at the top (where sellers consistently show up), and
-
A rising trendline at the bottom (where buyers step in at higher levels consistently).
The pattern takes the form of a triangle, where the distance between the trendlines narrows over time, depicting increasing buying strength. Price breaks above the horizontal resistance line with strong volume, indicating the pattern has broken out and price moves higher.

Structure of the Ascending Chart Pattern
To identify an ascending chart pattern, traders need the following three elements:
1. Flat Resistance Line (Ceiling)
At least two or more equal highs are made, indicating a price level where sellers are consistently blocking upward movement.
2. Rising Support Line (Floor)
A series of higher lows is connected, showing buyers are aggressively entering the market.
3. Convergence Point (Apex)
Formation of a tight zone of consolidation and a potential breakout.
4. Breakout Zone
The price breakout tunnel halts the pattern as the bullish volume moves hand in hand with the pattern change in price movement.
Example
A stock simply moves from place to place, forming resistance and higher lows at Rs. 460, Rs. 470, Rs. 480, and Rs. 490. When price breaks above Rs. 500, the volume moves strongly higher, indicating an ascending triangle breakout and the price has further bullish movement to make.
Ascending Triangle Pattern: What’s the Stance: Bullish or Bearish?
Traders frequently ask whether the ascending triangle pattern is bullish or bearish. What is the general outlook? An ascending triangle pattern is bullish by default. This means that it is likely the buyers are in the majority and are gaining enough strength for a breakout.
There are exceptions to the pattern. A drop in price below the rising trendline can lead to a minor bearish trend. Nonetheless, it is still an ascending bullish continuation pattern during the majority of the time, especially when appearing in an uptrend.
Using the Ascending Triangle Chart Pattern. What is the Market Psychology?
For this pattern to be useful, understanding the psychology of the traders is vital. A flat top resistance means that sellers are considerably active and possess the strength to push the price down. However, this does show that they are unwilling to exert more effort in the downward push.
The rising bottoms illustrate that buyers are strengthening their position by being more willing to purchase at higher prices. The price action is a battle of buyers and sellers, and convergence indicates buying pressure and selling resistance.
No matter how high the price is, selling pressure will lead to a breakout. This is a major reason why an ascending triangle pattern stock setup is so effective.
How to Find an Ascending Triangle Formation
To see if the ascending triangle chart pattern is valid, use this checklist:
1. There should be two or more equal highs forming a resistance level.
2. There should be two or more higher lows forming a rising support line.
3. As the pattern approaches the apex, the distance between the highs and lows should narrow.
4. This pattern should take several days, weeks, or months to form - not in the intraday session.
5. There should only be a breakout confirmed if the price closes above the resistance line and is accompanied by high volume.

How to Trade an Ascending Triangle
Patience, discipline, and confirmation are essential while trading the ascending triangle pattern. Below is a sequential manner to demonstrate this:
1. Identify the Setup
Look for a clear ascending triangle and an existing uptrend or a consolidation phase. Patterns are more reliable when the resistance is distributed more horizontally, and the rising trend line is steeper.
2. Wait for the Ascending Triangle Breakout
Do not jump in early. Wait for the ascending triangle breakout to occur with a decisive close above the resistance line. Volume should ideally be 1.5 to 2 times the daily moving average in order to confirm conviction.
3. Entry Point
You should open a long position when a breakout candle closes above the resistance line. Conservative traders may wait for a small pullback to retest the breakout level.
4. Stop-Loss Placement
Your stop-loss should be kept just below the most recent higher low or the lower trendline. Keeping your stop-loss here protects in the event the breakout fails.
5. Target Projection
One can find the ascending triangle pattern target by measuring the triangle’s height and adding it to the breakout point:
> Target = Breakout Price + (Height of Triangle)
Example:
If resistance is Rs. 500 and the lowest support is Rs. 450, the height = Rs. 50. If a breakout happens at Rs. 500, the target = Rs. 550.
Real Example of Ascending Triangle Pattern Stock
If you consider Tata Motors, which is trading between Rs. 750 (resistance) and Rs. 700 (rising support). As it forms higher lows at Rs. 710, Rs. 725, and Rs. 735, an ascending triangle begins to take shape.
When Tata Motors finally breaks Rs. 750 on high volume, it signals a bullish ascending triangle pattern breakout and the target becomes Rs. 800 (based on the triangle’s height of Rs. 50).
Analysing Rising Triangles Across Different Time Frames
Every time frame, from intraday charts (5 and 15 minutes) to weekly and even monthly charts, features rising triangles.
Intraday Traders- They incorporate the pattern to execute quick trades on volatile stocks.
Swing Traders- They identify the pattern on one-hour and daily charts to execute trades for 3 to 5 days.
Long-Term Investors- They use the pattern to identify medium-term uptrends on weekly charts.
Longer time frames provide better reliability of the pattern since institutional participation validates the price changes.
Benefits of the Ascending Triangle Pattern
High Accuracy- One of the most reliable patterns to identify bullish continuation patterns.
Clear Entry and Exit Levels- You can plan trades in advance because the pattern identifies resistance and support levels.
Works with Different Asset Classes:
The pattern works with stocks, forex, cryptocurrencies, and commodities.
Early Trend Detection- The pattern allows anticipation of potential breakouts before the price becomes highly volatile.
Beginner Friendly- The pattern is simple to identify and works even for novice traders.
Mistakes and Limitations
False Breakouts- Breakouts occurring below the expected volume can create a trap. Always ensure volume is present.
Premature Entries- The price could just be consolidating, making any entry before a breakout risky.
Ignoring Broader Market Context- Even the strongest patterns can fail during bearish markets. Always check the index sentiment first.
Improper Stop Loss- Having a stop too close can trigger exits too early. Consider using trend-line-based stops.
Combining the Ascending Triangle with Other Indicators
For the best results, integrate the ascending triangle pattern with:
RSI: When the RSI is rising, this indicates that the bullish momentum is strong.
MACD: A bullish crossover occurring close to a breakout indicates strong trend confirmation.
Volume Analysis: When breakout volume spikes, this indicates institutional buying.
Moving Averages: The price is more convincing if it is above the 50- or 200-day MA.
Ascending Triangle Pattern vs Descending Triangle Pattern
Although both can be extremely powerful, the descending triangle pattern indicates bearish weakness, while the ascending triangle pattern indicates bullish strength.
|
Feature |
Ascending Triangle |
Descending Triangle |
|
Trend Type |
Bullish continuation |
Bearish continuation |
|
Resistance Line |
Flat |
Downward-sloping |
|
Support Line |
Rising |
Flat |
|
Breakout Direction |
Upward |
Downward |
Loved the pattern of the rising triangle? Another effective setup for spotting promising breakout opportunities is the Cup and Handle Pattern: How to Trade Using Key Chart Patterns, which you should also investigate.

Conclusion
The ascending triangle chart pattern shows strong bullish sentiment and is one of the best patterns to use for momentum. You may trade ascending triangle pattern stocks with confidence and identify lucrative chances early if you can learn this ascending chart pattern, confirm breakouts with volume, and manage risk wisely. Knowing the rising triangle pattern will significantly increase your technical analysis and trading accuracy, regardless of your level of experience.

DISCLAIMER: This blog is NOT any buy or sell recommendation. No investment or trading advice is given. The content is purely for educational and information purposes only. Always consult your eligible financial advisor for investment-related decisions.


