There are certain shapes that get formed on a chart when plotting the price movement on it, and these are due to the repeating psychological movement of the investors in the market. Fear, greed, panic selling, breakout buying and accumulation. These are the market phases that we go through, and these are the phases that leave a pattern on a chart.
The top reasons for the benefits of stock chart patterns that it:-
-
Identifies when a trend can continue or when it will reverse.
-
Gives clear signals for entering and exiting the trade.
-
Works on all time frames.
-
It is applicable in day trading, swing trading, and long-term investing.
-
When paired with volume and confirmation candles, it achieves high accuracy.
Whether it is the best chart patterns for day trading or for longer durations of the trade, knowing the classics and mastering them can greatly improve your win rate.
1. Cup and Handle Pattern
The Cup and Handle is one of the strongest bullish chart patterns for accurate trades since it shows long accumulation, then a breakout.
How Does Cup and Handle Work?
There are 3 parts that make up this pattern.
1. Cup- a rounded bottom which represents consolidation
2. Handle- a short pullback before the breakout
3. Breakout- occurs above the handle resistance

Why Cup and Handle Chart Pattern Works
Because it traps the weak sellers before the price moves a lot upwards, which allows it to work really well.
Use
The Cup and Handle Pattern is best for positional and swing trading.
2. Double Bottom Pattern
A trustworthy bullish reversal pattern that appears after a considerable downtrend.
How It Works
Two identical lows shape a ''W."
When the neckline is broken, the trend reversal is confirmed.

Why It’s Effective
This pattern indicates that the sellers have run out of power and that the buyers are regaining control of the market.
Best For
This pattern is best used for trend reversals in both stocks and cryptocurrency.
3. Head and Shoulders Pattern
This is one of the most reliable reversal trading chart patterns.
How It Works
Left Shoulder: the first peak
Head: the highest peak
Right Shoulder: the lowest peak
When the neckline is broken, that is a bearish confirmation for the pattern.

Why It's Effective
This pattern clearly indicates weakness in the overall momentum of the market, and shows that a trend reversal is close.
Best For
This pattern is best for identifying shorting opportunities in the stock market, indices, and forex trading.
4. Bull Flag Pattern
This pattern is one of the best flag patterns for day trading, and is a crowd favourite among day traders.
How It Works
-
A strong upward trend occurs.
-
Price then consolidates downwards, or sideways in a ''flag'' shape.
-
A breakout occurs, continuing the previous trend.

Why It's Effective
Bull flags indicate a healthy pullback in otherwise strong trends and provide excellent opportunities for continuation.
Best For
This pattern is best for intraday trading, breakout trading, and trading on momentum.
5. Bear Flag Pattern
The opposite of a bull flag. Generally, a strong setup for shorting.
How it Works
- There is a sharp decline.
- There is a short upward consolidation.
- There is a continuation of the breakdown.

Why It Works
It captures momentum-based continuation to the downside.
Best For
Best used for intra-day and swing shorts.
6. Symmetrical Triangle Pattern
One of the most versatile patterns (and one of the most common). It signals a consolidation period before a breakout.
How it Works
- Prices make lower highs and higher lows.
- Breakout could occur in either direction.
- Volume contraction is key to look for.

Why It Works
Perfect for pre-breakout positioning.
Best For
Both bullish and bearish setups. Works for all time frames.
7. Ascending Triangle Pattern
A bullish continuation pattern is widely used by professional traders.
How it Works
- There is flat resistance
- There are higher lows
- A breakout above the resistance indicates bullish strength.

Why it Works
It is clear to see the strength in the buyers and the exhaustion in the sellers.
Best For
Best for high-accuracy trades during the uptrends.
8. Descending Triangle Pattern
Descending triangle pattern is a bearish continuation pattern. The opposite of the ascending triangle pattern.
How Does the Flat Support Level Work
-
The market has flat support.
-
The market creates lower highs.
-
Market breaks support, confirming bearish momentum.

Best For
Trades on the shorts in weak markets for sure.
9. Double Top Pattern
This one is one of the strongest bearish reversal chart patterns traders can find.
How Does It Work
-
The market forms 2 equal highs at peaks.
-
It market has trouble breaking through the resistance of the peak 2 times.
-
It then breaks the support in the downward movement, which is the neckline.

Why It is Effective
It catches trendy markets right before sharp corrections.
Best For
This pattern is best for swing traders and is used for looking for shorts on the double top pattern.
How To Identify High Accuracy Chart Patterns
To achieve high accuracy for getting trades, always check for these things
Volume Confirmation
A strong volume is more valuable and denotes more volume and confidence in the direction of the candles.
Trend Context
It is always best when chart patterns fit with the direction of the contesting market trend.
Candle Confirmation
This denotes that traders should wait for the closure of the candle and should not act before.
No Overlapping Signals
Don't trade patterns; major news events should be avoided. Don't trade when the market is too volatile.
Best Chart Patterns for Day Trading
If you're a day trader, focus on patterns that offer quick breakout or breakdown moves:
- Bull Flag
- Bear Flag
- Triangle Breakouts
- Double Top/Bottoms
- Breakout Pullback Patterns
These patterns offer fast momentum and cleaner entries.
Why Chart Patterns Work Across All Markets
Whether you are trading stocks, crypto, commodities, or forex, chart patterns remain relevant because they represent human behaviour-not just price.
Supply, demand, stop losses, panic selling, and breakout buying create consistent shapes in a repeated manner. That’s why the best chart patterns continue to be accurate, even decades after their discovery.

Conclusion
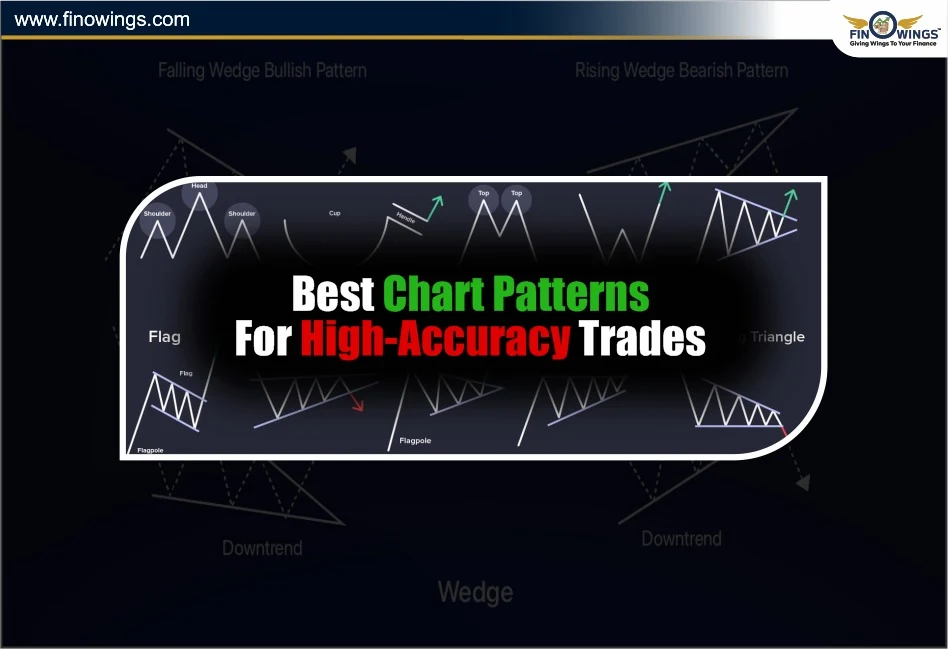
Mastering chart patterns is one of the most effective ways to improve your trading accuracy. The patterns listed above – Cup and Handle, Double Bottom, Head and Shoulders, Flags, and Triangles – are the most reliable chart patterns for accurate trades used by professionals worldwide.
Whether you are focused on positional trades or want the best chart patterns for day trading, these setups can greatly enhance your trading confidence and consistency. Pair them with trend confirmation along with volume analysis to easily spot high probability trading opportunities.

DISCLAIMER: This blog is NOT any buy or sell recommendation. No investment or trading advice is given. The content is purely for educational and information purposes only. Always consult your eligible financial advisor for investment-related decisions.


.webp)