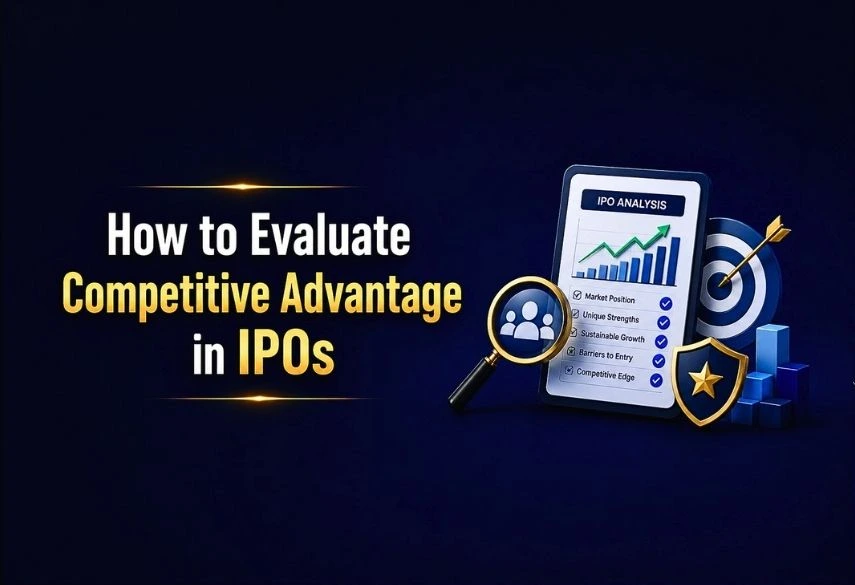
To evaluate competitive advantage in an IPO, study whether the company has durable strengths that competitors cannot easily copy. Look for evidence of brand strength, pricing power, switching costs, network effects, cost advantages and efficient scale in the DRHP or S-1, and then verify those claims using financial metrics, customer behaviour and competitor comparisons.
Growth can attract competitors. Discounts can temporarily increase customers. Heavy marketing can create visibility. Even impressive revenue growth can disappear if the business has nothing protecting it from rivals. What stops another company from taking away this business's customers and profits?
The answer helps you identify the company's competitive advantage, often described as an economic moat. This guide explains how beginners can evaluate the economic moat of an IPO before investing.
Competitive Advantage in an IPO?
A competitive advantage is a structural strength that allows a business to perform better than competitors over a long period.
It could come from:
- A trusted brand
- Lower operating or production costs
- Proprietary technology
- Patents or licenses
- A large user network
- High customer switching costs

A temporary discount, viral marketing campaign, or first-mover advantage may help a company grow, but those factors do not automatically create a sustainable economic moat.
The real test is:
Can competitors copy the company's advantage without spending enormous amounts of money, time, or effort?
If the answer is yes, the company's moat may be weak.
If the answer is no—and the company can protect its customers, margins and returns for many years—the business may possess a stronger competitive advantage.
Why Competitive Advantage Matters Before Investing in an IPO
Evaluating an established listed company is relatively easier because investors may have years of public financial statements, market behaviour and management commentary to study.
A company entering the public market has a shorter history as a listed business. Investors therefore depend heavily on its offer documents, available financial history, industry data and management disclosures.
Imagine two companies.
Company A is growing revenue at 50% annually but operates in an industry where competitors can easily launch similar products.
Company B is growing at 25% but has:
- High customer retention
- Strong pricing power
- Proprietary technology
- Lower operating costs
- Difficult-to-replicate distribution
Company A may look more exciting.
But Company B may have a better chance of protecting profitability over the long term.
This is why IPO fundamental analysis should examine the quality and durability of growth, not only the growth rate.
What Is an Economic Moat?
The term "economic moat" describes a durable competitive advantage that helps protect a company from competition.
Morningstar's economic-moat framework identifies five major sources of durable competitive advantage:
- Intangible assets
- Switching costs
- Network effects
- Cost advantage
- Efficient scale
Morningstar considers a wide moat to be an advantage expected to persist for 20 years or more, while a narrow moat represents a competitive edge expected to last at least around 10 years.
An investor does not need to formally assign a Morningstar-style moat rating to an IPO.
Instead, the framework can be used as a checklist to test management's claims.
5 Types of Economic Moats
1. Intangible Assets: Brand, Patents and Licenses
Intangible assets can create powerful competitive advantages.
Examples include:
- Strong brand recognition
- Patents
- Exclusive licenses
- Proprietary intellectual property
- Regulatory approvals
- Unique datasets
But merely owning a brand or patent is not enough. The important question is whether that intangible asset creates a measurable economic benefit.
For a brand, look for:
- Premium pricing
- High repeat purchases
- Strong customer loyalty
- Lower customer acquisition costs over time
- Organic/direct traffic
- Strong market share
- Lower dependence on discounts
For patents or intellectual property, ask:
- Does the patent protect an important revenue-generating product?
- How long does the protection last?
- Can competitors develop an alternative?
- Does the technology materially reduce costs or improve customer experience?
A company saying "we have a strong brand" is not proof. The financial and operating numbers should support the claim.
2. Switching Costs
Switching costs exist when customers find it expensive, difficult or inconvenient to move to a competitor. These costs do not have to be purely financial.
They can include:
- Data migration
- Employee retraining
- Integration costs
- Workflow disruption
- Loss of accumulated information
- Contractual restrictions
- Time required to implement another platform
Switching costs can be particularly important for enterprise software, financial infrastructure and specialized business services.
How to identify switching costs in an IPO prospectus
Look for metrics such as:
- Customer retention rate
- Churn rate
- Contract duration
- Renewal rate
- Revenue from repeat customers
- Net revenue retention
- Number of products used per customer
- Integration with customer workflows
Suppose a software company retains 95% of enterprise customers annually despite competitors offering cheaper alternatives.
That could indicate switching costs. However, investors should determine why customers remain. If customers stay only because they receive discounts, the moat may be weaker than it appears.
3. Efficient Scale
Efficient scale exists when a market is naturally large enough for only a limited number of profitable competitors. If a new competitor enters such a market, the economics may deteriorate for everyone. That can discourage new entrants. Efficient scale can be powerful, but only when the market structure genuinely limits competition.
How to Find Competitive Advantages in a DRHP or S-1
For an Indian IPO, investors can study the company's Draft Red Herring Prospectus (DRHP) and subsequent offer documents. For a US IPO, the comparable registration document is generally the Form S-1. Do not read hundreds of pages randomly.
Start with the sections most likely to reveal the quality of the business.
1. Business
Understand:
- What the company sells
- How it earns money
- Who its customers are
- How customers are acquired
- Major products/services
- Revenue model
- Geographic reach
If you cannot explain the business model simply, do not move to valuation yet.
2. Competitive Strengths
Companies usually explain what they believe differentiates them. Possible claims include:
- Market leadership
- Strong brand
- Proprietary technology
- Large distribution network
- Scale
- Customer relationships
Treat these as claims to investigate, not conclusions. Your job is to find supporting evidence elsewhere in the document.
3. Industry and Competition
Identify:
- Major competitors
- Market growth
- Market share
- Entry barriers
- Substitute products
- Industry profitability
Ask:
If this market is attractive, why won't more competitors enter? That question often reveals whether a real moat exists.
4. Risk Factors
Do not skip this section. Risk factors can reveal weaknesses hidden behind the "competitive strengths" section.
For example, management may claim high customer loyalty while simultaneously disclosing heavy dependence on discounts.
Or it may claim proprietary technology while acknowledging that competitors can develop similar solutions.
5. Intellectual Property
For technology-heavy companies, inspect:
- Patents
- Trademarks
- Copyright
- Proprietary software
- Licenses
Then ask whether those assets actually prevent competition. Patent quantity alone tells you very little. One commercially critical patent can be more valuable than hundreds of weak ones.
How to Evaluate Brand Strength and Pricing Power
A famous brand is not automatically an economic moat. The best test is whether the brand affects customer behaviour and financial performance. Signs of genuine brand strength
Look for:
- High repeat purchase rates
- Strong unaided brand awareness
- Organic customer acquisition
- Premium pricing
- Lower promotional dependence
- High retention
- Strong market share
What Is Pricing Power?
Pricing power is a company's ability to increase prices without suffering a disproportionate decline in customer demand.
Suppose input costs increase by 10%.
Company A raises prices and retains most customers.
Company B cannot raise prices because customers immediately move to competitors.
Company A probably has stronger pricing power.
Financial indicators of pricing power
The strongest evidence appears when a company successfully passes rising costs to customers while maintaining demand.
How to Evaluate an IPO's Technology Advantage
Technology companies commonly describe themselves using phrases such as:
- Proprietary platform
- AI-powered
- Machine-learning technology
- Advanced algorithm
- Data-driven platform
These words alone prove nothing. A real technology moat should produce a measurable advantage.

Financial Metrics That Can Confirm an Economic Moat
Financial analysis helps determine whether the moat is producing economic value.
1. Return on Invested Capital (ROIC)
ROIC measures how efficiently a company generates operating profit from the capital invested in the business.
A simplified formula is:
ROIC = NOPAT ÷ Invested Capital
where NOPAT is net operating profit after tax.
In general, a company consistently earning returns above its cost of capital is creating economic value.
But be careful with newly listed or loss-making companies.
ROIC may be less informative when:
- The company is not profitable
- The business is investing heavily for expansion
- Historical financial data is limited
- Accounting treatments distort invested capital.
In those cases, examine additional operating metrics rather than forcing a conclusion from ROIC alone.
2. Gross Margin
Gross margin can reveal:
- Pricing power
- Product economics
- Cost advantage
- Competitive pressure
Compare the company's margins against competitors and across multiple years. Stable or improving margins can be positive. But always determine why margins changed.
3. Operating Margin
Operating margin shows what remains after operating expenses. A business with a real scale advantage may eventually demonstrate operating leverage:
Revenue grows faster than operating expenses.
Again, compare the trend rather than one isolated number.
4. Free Cash Flow
Accounting profit and cash generation are different. A quality business should eventually convert a meaningful portion of its earnings into cash.
Examine:
- Operating cash flow
- Capital expenditure
- Free cash flow
- Working-capital requirements
A business requiring enormous incremental capital simply to maintain growth may have weaker economics than headline revenue suggests.
5. Customer Retention
For subscription, marketplace and recurring-revenue businesses, retention can be one of the strongest moat indicators.
High retention may indicate:
- Strong product-market fit
- Switching costs
- Network effects
- Brand loyalty
But always compare retention with customer acquisition spending.
6. Market Share
Increasing market share can indicate competitive strength. But market share bought through unsustainable discounts is less impressive.
Ask:
Is market share increasing because the product is better—or because the company is spending more than competitors to acquire customers?
Real IPO Example: How to Think About Zomato's Competitive Advantage
Consider Zomato as an illustrative case study.
Before its 2021 IPO, investors could examine its offer documents rather than simply assuming that a recognizable consumer brand automatically represented a wide economic moat.
Zomato's prospectus described a strategy of expanding and strengthening its ecosystem across food delivery, dining-out and Hyperpure. It also discussed attracting customers, increasing engagement, growing restaurant partners and investing in delivery infrastructure.
An investor applying the moat framework could then ask:
Brand
Does Zomato's brand help attract customers organically and reduce reliance on discounts?
Network Effects
Do more customers attract more restaurant partners—and does greater restaurant selection, in turn, make the platform more useful to customers?
Switching Costs
Can restaurants or consumers easily use competing platforms simultaneously? If yes, switching costs may be limited even if the platform is large.
Cost Advantage
Does greater order density reduce delivery costs per order? If so, can that scale advantage translate into superior unit economics?
Technology
Does Zomato's data, logistics infrastructure and platform technology create an advantage competitors cannot reproduce quickly?
Competitive Advantage Red Flags in an IPO
Some warning signs suggest that a company's claimed moat may be weaker than it appears.
1. Growth Depends Heavily on Discounts
If customers disappear when promotions stop, loyalty may be weak.
2. Marketing Costs Rise as Revenue Grows
A strong brand should eventually make customer acquisition more efficient. Constantly increasing acquisition spending deserves investigation.
3. Competitors Offer Almost Identical Products
Low differentiation usually limits pricing power.
4. Customers Can Switch Instantly
If switching takes minutes and costs nothing, customer relationships may be less durable.
5. Margins Keep Falling
Declining margins can indicate:
- Price competition
- Rising customer acquisition costs
- Weak bargaining power
- Increasing input costs
- Lack of differentiation
6. Management Uses Vague Technology Claims
Terms such as "AI-powered" or "proprietary technology" should be supported with evidence. Ask how the technology affects:
- Revenue
- Costs
- Retention
- Conversion
- Market share
7. Market Share Is Purchased Rather Than Earned
Rapid market-share gains financed by unsustainable discounts can reverse when incentives disappear.
8. One Customer or Supplier Has Excessive Power
Customer concentration or supplier dependence can weaken an apparent moat.
IPO Economic Moat Analysis Checklist
Use the following checklist while reading an IPO document.
|
Factor |
What to Check |
Strong Signal |
Weak Signal |
|
Brand Strength |
Customer loyalty, repeat purchases, brand recognition, premium pricing |
High retention, premium pricing, strong repeat purchases |
Heavy discounting required to retain customers |
|
Pricing Power |
Price increases, gross margins, customer volumes |
Prices increase without major customer loss |
Customers switch after price increases |
|
Switching Costs |
Retention, integrations, contracts, migration difficulty |
Difficult or expensive for customers to leave |
Customers can easily switch platforms |
|
Network Effects |
User growth, platform activity, buyer-seller interaction |
More users make the platform more valuable |
User growth does not improve product value |
|
Cost Advantage |
Unit economics, sourcing, manufacturing and distribution costs |
Persistently lower costs than competitors |
Similar or higher costs than competitors |
|
Efficient Scale |
Market size, entry barriers, number of competitors |
Market economically supports only a few players |
New competitors can enter easily |
|
Technology Advantage |
Proprietary technology, data, patents, integrations |
Technology creates measurable and hard-to-copy benefits |
Generic technology competitors can replicate |
|
ROIC |
Return on invested capital over time |
Consistently attractive returns on capital |
Low or declining returns |
|
Market Share |
Market-share growth and acquisition economics |
Sustainable and profitable market-share gains |
Growth mainly driven by discounts |
|
Cash Flow |
Operating cash flow, capex, free cash flow |
Strong cash conversion |
Constant external capital required |
Do not treat this as a mechanical scoring system. A business may have one extremely powerful moat source rather than five moderate ones. The objective is to understand why competitors cannot easily destroy the company's economics.
A Simple 7-Step Process for Beginners
If you are analyzing an IPO for the first time, follow this sequence.
Step 1: Understand the Business
Explain the business model in two or three sentences. If you cannot, study it further.
Step 2: Identify Management's Claimed Advantages
Write down every major competitive strength mentioned in the offer document.
Step 3: Classify the Moat
Determine whether each advantage comes from:
- Intangible assets
- Switching costs
- Network effects
- Cost advantage
- Efficient scale
Step 4: Search for Evidence
Look for operating and financial evidence supporting each claim.
Step 5: Read the Risk Factors
Try to find information that contradicts your thesis. Good investment analysis attempts to disprove an idea, not only confirm it.
Competitive Advantage vs IPO Hype
IPO excitement can make investors focus on:
- Grey market premium
- Oversubscription
- Social-media sentiment
- Listing gains
- Recent revenue growth

Conclusion
The best IPO is not necessarily the company growing the fastest. For long-term investors, the more important question is whether that growth is defensible. When evaluating competitive advantage in an IPO, investigate five major sources of economic moat:
- Intangible assets
- Switching costs
- Network effects
- Cost advantages
- Efficient scale
Finally, read the risk factors and actively search for evidence that could invalidate your thesis. A compelling IPO story may attract attention. A durable economic moat is what can potentially protect the business after the excitement fades.
(Sources: Indmoney, Livemint, Research Gate)

DISCLAIMER: This blog is NOT any buy or sell recommendation. No investment or trading advice is given. The content is only for educational purposes. Always discuss with your SEBI-registered financial advisor for investment-related decisions.