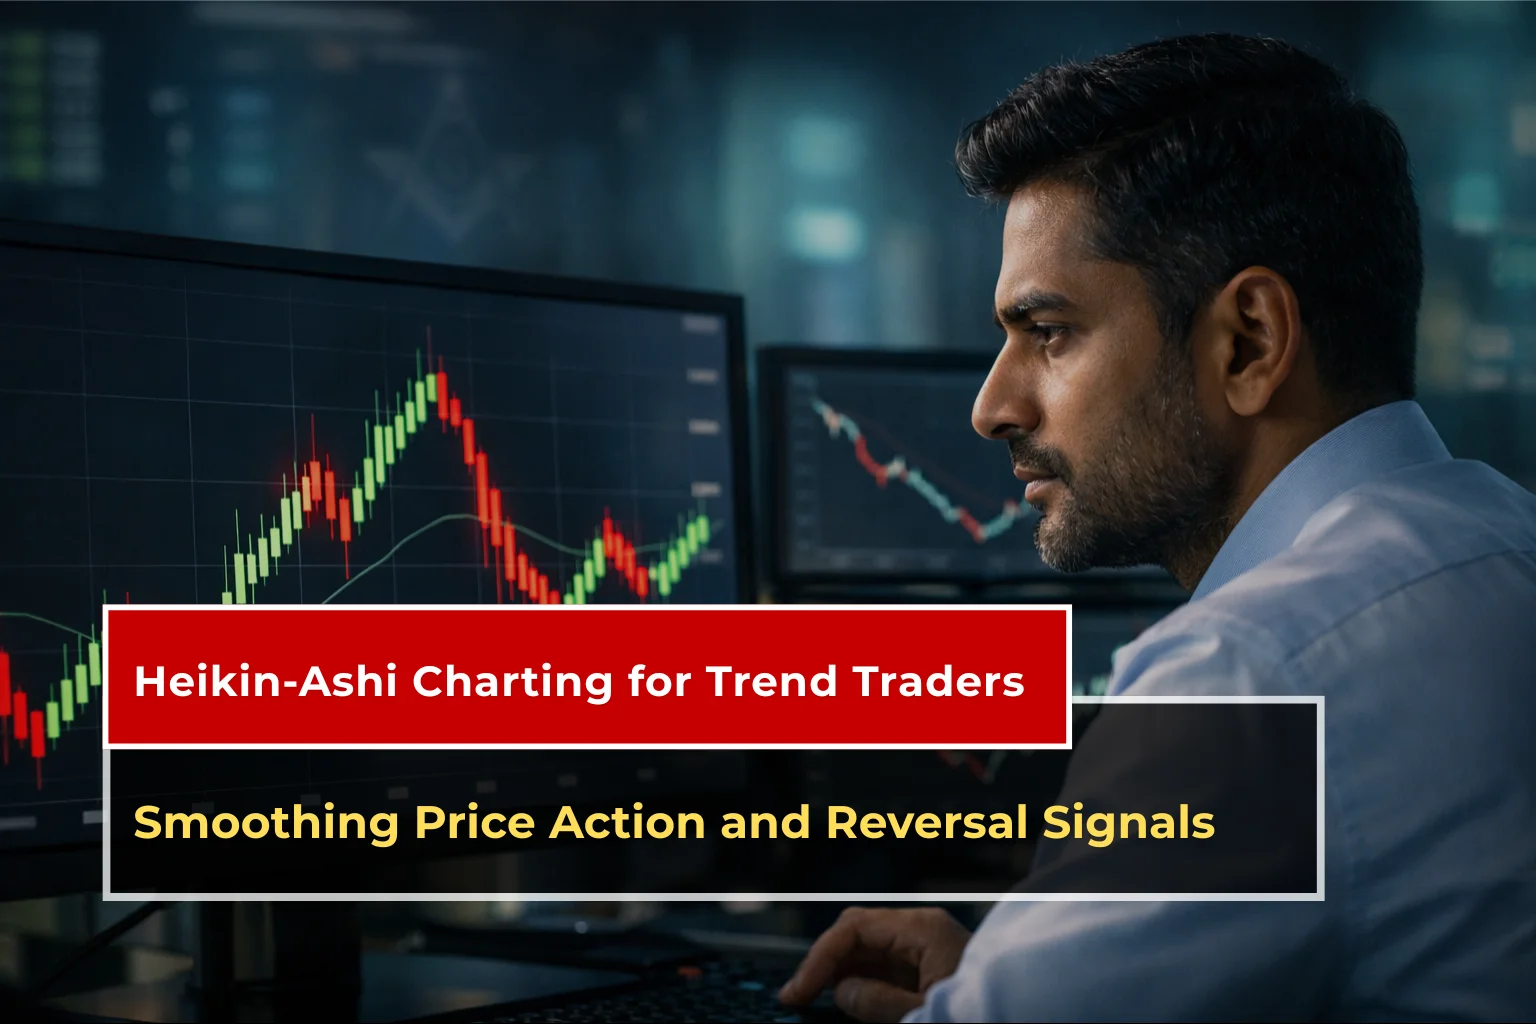
Struggling with choppy charts that make every small price move look like a trend change? If you’re a beginner trader who wants to follow the real market direction without getting distracted by noise, Heikin-ashi charting offers a cleaner and simpler way to view price action. This modified candlestick method averages prices to highlight the overall trend, helping you stay calm and focused during strong moves.
In this complete beginner-friendly guide, you’ll discover how heikin ashi charting works, its pros and cons, when to use it instead of regular candlesticks (especially for intraday), the best timeframes, a practical strategy with advanced entry and exit rules, common mistakes, and risk management tips. Everything is explained in simple words so you can start using it confidently.
What Is Heikin-Ashi Charting?
Heikin ashi(Japanese for “average bar”) is a special type of candlestick chart that reduces random ups and downs. Regular candlesticks show every exact price tick, which can create a messy picture in volatile markets. Heikin ashi blends current and previous candle data to produce smoother candles that make trends much easier to spot.
It acts as an excellent price action smoothing technique, allowing trend traders to see the bigger picture clearly without getting shaken out by temporary wiggles.
Pros and Cons of Heikin-Ashi Charting
Here’s a clear, snippet-friendly breakdown of the main advantages and disadvantages:
Pros:
-
- Smoother trends with longer sequences of the same color candles.
-
- Fewer false signals and less market noise.
-
- Easier identification of trend strength (small or no wicks show strong momentum).
-
- Great visual clarity for beginners.
-
- Helps traders stay in winning trends longer.
Cons:
-
- Slight lag due to averaging (signals can be delayed).
-
- Does not show exact real-time open and close prices.
-
- Less effective in sideways or choppy markets.
-
- Can hide precise price levels needed for tight stops.
-
- Not ideal for ultra-fast scalping.
Many traders solve the cons by using Heikin Ashi for trend direction and regular candlesticks for exact entries and exits.

Heikin-Ashi vs Regular Candlesticks: Key Differences
Regular candlesticks give you the true open, high, low, and close for each period — perfect for detailed patterns and precise trading.

Heikin ashi charting changes the calculation to average values, resulting in cleaner visuals but with a small delay.

(Source: Syncfusion)
Heikin-Ashi vs Candlesticks for Intraday Comparison
For intraday trading (day trading), regular candlesticks are often preferred because they show real-time price action and quick reversals without lag. Heikin ashi can feel slower on 1-minute or 5-minute charts, potentially causing you to miss fast moves or enter late.
However, on 15-minute or higher intraday charts, heikin ashi helps filter out noise during trending sessions, making it useful for confirming momentum once you’ve identified a level on regular candles.
In short: Use regular candles for precision and speed in intraday scalping. Use heikin ashi for smoother trend confirmation on slightly longer intraday or swing timeframes.
How to Read Heikin-Ashi Candles (Beginner Guide)
Reading these candles is easy once you know the basics:
-
- Green candle: Upward pressure (average close higher than average open).
-
- Red candle: Downward pressure.
-
- Long green candle with no lower wick: Very strong buying.
-
- Long red candle with no upper wick: Very strong selling.
-
- Small body with long wicks on both sides: Indecision or possible reversal.
A series of green candles with tiny wicks means the uptrend is healthy. Watch for a sudden small candle with big wicks after a long trend — it often signals that momentum is fading.
The Simple Heikin-Ashi Formula
No complicated math needed. Here’s the step-by-step calculation:-
1. HA Close = (Open + High + Low + Close) ÷ 4.
2. HA Open = (Previous HA Open + Previous HA Close) ÷ 2.
3. HA High = Maximum of current High, HA Open, HA Close.
4. HA Low = Minimum of current Low, HA Open, HA Close.
Color the candle green if HA Close > HA Open, red otherwise.
Example Data Table Showing the Smoothing Effect
|
Period |
Regular Close |
HA Open |
HA High |
HA Low |
HA Close |
Color |
Observation |
|
1 |
102 |
101.00 |
105 |
95 |
100.50 |
Red |
Base period |
|
2 |
108 |
100.75 |
110 |
100.75 |
105.25 |
Green |
Uptrend starts |
|
3 |
111 |
103.00 |
112 |
103 |
109.25 |
Green |
Strong continuation |
|
4 |
105 |
106.125 |
109 |
104 |
107.25 |
Green |
Trend holds despite small dip |
Notice how the heikin ashi version stays green longer — this is the price action smoothing technique in action.
Source: (babypips)
Best Timeframes for Heikin-Ashi Charting
Heikin ashi charting performs best on timeframes where trends have room to develop:
- Daily and weekly charts: Excellent for swing and position trading — least noise, clearest trends.
- 4-hour and 1-hour charts: Great balance for swing traders and part-time intraday traders.
- 15-minute charts: Usable for intraday trend confirmation, but combine with regular candles.
- 5-minute or lower: Possible but not ideal due to increased lag — better for experienced traders only.
For most beginners, start with daily charts to practice spotting trends, then move to 4-hour or 1-hour charts for actual trading. Higher timeframes generally give more reliable signals with this method.
Who Should Use Heikin-Ashi and Who Should Avoid It
Who should use it:
-
- Beginner trend traders who get overwhelmed by noise.
-
- Swing and position traders who want to ride bigger moves.
-
- Anyone who prefers visual simplicity and fewer false signals.
-
- Traders who combine it with other trend trading indicators.
Who should avoid or use cautiously:
-
- Pure scalpers on 1-5 minute charts (lag hurts quick decisions).
-
- Traders who need exact real-time prices for tight stops.
-
- Those trading in very choppy, sideways markets.
Many successful traders use both charts together: heikin ashi for the big picture and regular candlesticks for timing.
Practical Heikin-Ashi Strategy + Advanced Entry/Exit Rules
Basic Heikin-Ashi Strategy:
-
- Buy when you see 2-3 consecutive green candles with small or no lower wicks.
-
- Sell/short when you see 2-3 consecutive red candles with small or no upper wicks.
-
- Stay in the trade as long as the color remains the same and wicks stay small.
If you want a more step-by-step breakdown with real trade examples and clearer entry-exit rules, you can also explore our detailed guide on Heikin-Ashi Trading Strategy | How to Use Heikin-Ashi Candlestick, where everything is explained in a more practical, action-based format.
Advanced Confirmation Rules for Better Entries and Exits:
-
- Entry (Long): Wait for a color change from red to green + a second confirming green candle + price above a 50 or 200-period moving average + RSI above 50 (not overbought).
-
- Strong Entry: Green candle with no lower wick after the confirmation candle.
-
- Exit (Long): First red candle appears, or small doji-like candle with long wicks, or price closes below a key moving average.
-
- Trailing Stop: Move your stop to the recent swing low as long as strong green candles continue.
Combining with a higher volume on color changes adds confidence. Always wait for confirmation to reduce false reversals.
Source: Schwab
Best Indicators to Combine with Heikin-Ashi
-
- Moving Averages (50 & 200) → Confirm overall trend direction.
-
- RSI → Avoid entries in overbought/oversold zones.
-
- MACD → Spot momentum shifts early.
-
- Support/Resistance levels from regular candlestick charts.
Example setup: Only take long trades when Heikin-Ashi turns green above the 200 MA with RSI between 50-70.
Heikin-Ashi Reversal Signals
Reversals often appear clearly:
-
- After many green candles: Small body with long upper and lower wicks.
-
- Sudden color flip after a strong trend.
-
- Series of shrinking candles with increasing wicks.
Wait for at least one confirming candle in the new direction before acting.
Common Beginner Mistakes to Avoid
- Using heikin ashi prices for exact stop-loss placement
- Entering on the very first color change without confirmation
- Ignoring lag on short timeframes
- Trading it alone in ranging markets
- Forgetting to check the regular candlestick chart for real levels
Start on a demo account and backtest your rules.
Risk Management and Stop-Loss Ways
Always use proper risk management:
- Risk no more than 1% of your capital per trade.
- Place stops on the regular candlestick chart (below recent swing lows for longs).
- Use trailing stops when strong same-color candles continue.
- Keep position size small until you gain experience.
Limitations and Disadvantages in Detail
The main limitations are the built-in lag and lack of exact prices. This makes it less suitable for high-frequency intraday scalping or when you need pinpoint accuracy. In sideways markets, candles can become small and give mixed signals. Always pair it with other tools and never rely on it 100% alone.

Final Thoughts
Heikin ashi charting is a powerful candlestick alternative trading tool that smooths price action and makes trend trading much more enjoyable. It shines for spotting strong moves and heikin ashi reversal signals, especially when you understand its strengths and limitations.
Practice on TradingView by switching to the Heikin Ashi chart type. Use it alongside regular candles, apply solid risk management, and you’ll soon ride trends with more confidence and fewer emotional decisions.
Start small, stay consistent, and let the smoother trends work in your favor. Happy trading!
(Sources: TradingView)

DISCLAIMER: This blog is NOT any buy or sell recommendation. No investment or trading advice is given. The content is purely for educational and information purposes only. Always consult your eligible financial advisor for investment-related decisions.