What is Altman’s Z-Score Model?
A numerical statistic called Altman's Z-Score is employed to forecast a company's likelihood of declaring bankruptcy during the next two years. To assess the monetary sustainability of businesses, American finance professor Edward Altman created the model in 1968.
Altman's Z-score list, which utilizes numerous balance sheet variables and corporate income, is useful for determining any firm's level of monetary hardship. For example, when firms saw a substantial increase in failure rates during the Great Depression, Altman thought of creating a model for forecasting bankruptcy.
1. Altman's Z-Score Model Explained
The Z-score formula was developed to determine the likelihood that a business will fail within the next two years. In multiple cases, the model has proven to be a reliable way to anticipate bankruptcy. Research demonstrates that the model has a 72% accuracy in forecasting bankruptcy two years in advance and a 6% false positive rate. The percentage of false positives was lower than the false-positive rate produced whenever the model was applied to forecast bankruptcy one year in advance, ranging from 15% to 20%.
Altman used a weighting method with other ratios that gauged the likelihood of a corporation filing for bankruptcy while developing the Z-score model. Altman produced three distinct Z-scores for various business models. The first version, introduced in 1968, was created especially for publicly traded production firms with more than $1 million in assets. Private corporations and non-manufacturing businesses with assets under $1 million were excluded from the initial model.
Altman created two additional models to be utilized by smaller private production enterprises later in 1983. The Model A Z-score was established especially for private industrial firms, while the Model B Z-score was established for privately held businesses. The 1983 Z-score models included a range of factors, predictive scoring schemes, and weighting.
2. The formula for Altman's Z-Score Model
The 10-K report's data calculate the Z-score model, which depends on five important financial ratios. It improves the model's accuracy whenever calculating a company's financial performance and the likelihood of bankruptcy.
The following is how Altman's Z-score formula is written:
Altman’s Z-score = 1.2A + 1.4B + 3.3C + 0.6D + 1.0E
Where:
-
Zeta (ζ) is Altman’s Z-score
-
A refers to the Working Capital/Total Assets ratio.
-
B is indeed the Retained Earnings/Total Assets ratio.
-
C is indeed the Earnings Before Interest and Tax/Total Assets ratio.
-
D is indeed the Market Value of the Equity/Total Liabilities ratio.
-
E is indeed the Total Sales/Total Assets ratio.
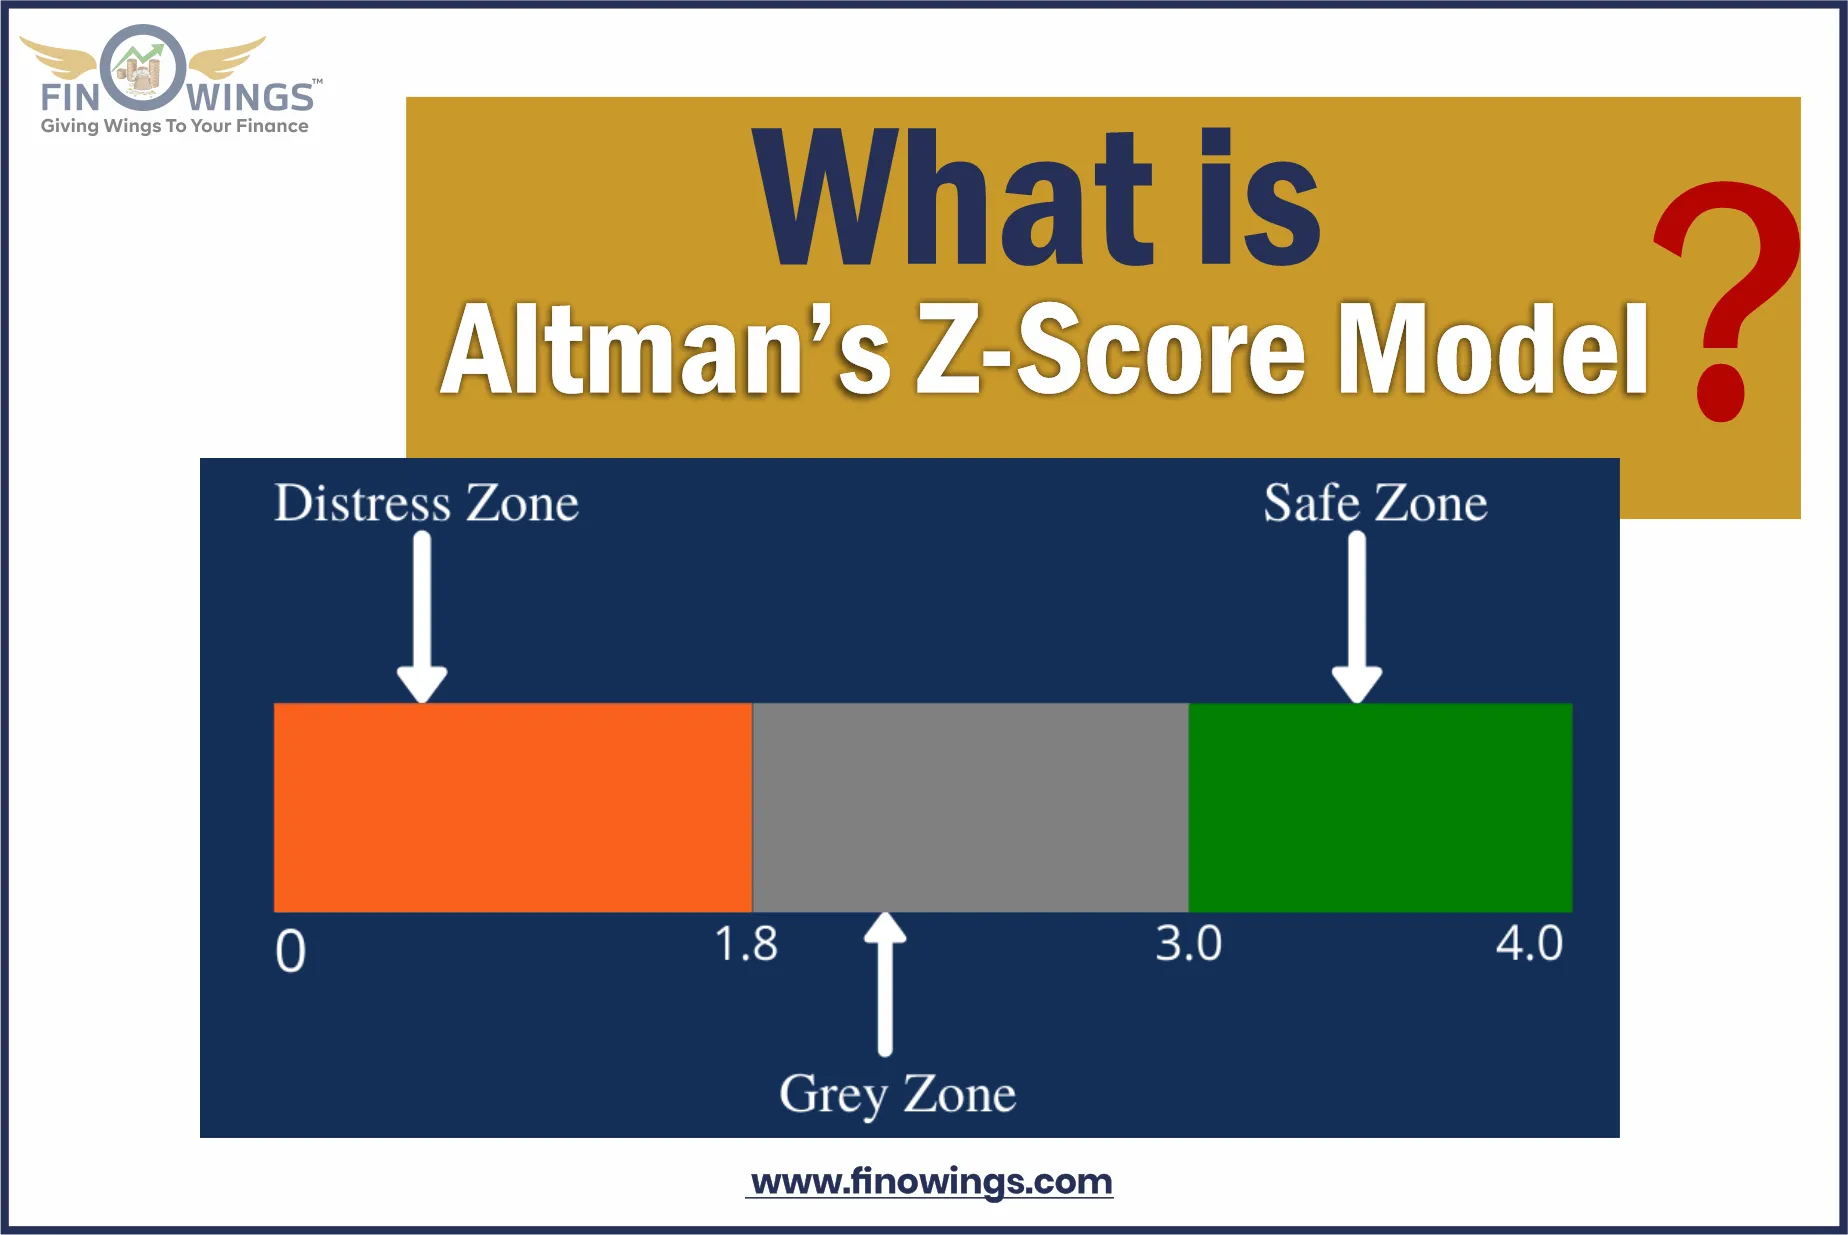
3. What Z-Scores Mean
Generally speaking, the likelihood that a corporation may file for bankruptcy increases with decreasing Z-scores. For example, a corporation is in financial difficulties and likely to file for bankruptcy if its Z-score is less than 1.8. A score of 3 or higher shows that the company is in good shape and unlikely to file for bankruptcy. A score of 1.8 to 3 indicates that the firm is in the grey region and has a moderate likelihood of declaring bankruptcy.
Based on the financial health of an organization, investors apply Altman's Z-score to decide whether to purchase or sell its stock. For example, investors may think about buying the organization's stock if a company's Z-score is near 3, as there is little chance it will fail within the next two years.
Furthermore, suppose a firm's Z-score is nearer to 1.8. In that case, investors may consider selling the company's stock to protect their capital because the score denotes a significant likelihood that the organization would fail.
4. Explaining Z-Five Score's Financial Ratios
The important financial ratios that help compensate for the Z-score model are as follows:
4.1 Working Capital/Total Assets
The differential between a company's current assets and current liabilities is known as working capital. The size of its working capital determines a company's short-term financial stability. A corporation can satisfy its short-term financial responsibilities and have money left over to develop and expand if its working capital is positive.
Negative working capital, on the other hand, denotes a company's inability to satisfy its short-term financial responsibilities due to insufficient current assets.

4.2 Retained Earnings/Total Assets
The retained earnings assets ratio shows the quantity of retained profits or losses. Low retained earnings to total assets indicate that a corporation borrows money to pay for its expenses instead of using money from its retained earnings. As a result, it makes a company's chance of bankruptcy higher.
On the other side, a high ratio of retained earnings to overall assets indicates that a business utilizes its retained earnings to pay for capital expenditures. It demonstrates that the business has been profitable and is not dependent on borrowings.
4.3 Earnings Before Interest and Tax/Total Assets
EBIT, a metric measuring an organization's profitability, describes a firm's capacity to produce profits from its activities. The EBIT/Total Assets ratio illustrates a company's capacity for revenue generation necessary to maintain profitability, finance current operations, and pay the debt.
4.4 Market Value of Equity/Total Liabilities
The market value of a firm's equity is sometimes referred to as its market capitalization. It is calculated by dividing the number of outstanding shares by the stock's existing cost.
The stock market value to total liabilities ratio illustrates how much a firm would lose in market value if it filed for bankruptcy before the total of its obligations and assets exceeded that level. When the market value of the equity to total liabilities ratio is high, investors may positively perceive the company's economic soundness.
4.5 Sales/Total Assets
The sales-to-total-assets ratio demonstrates how well management generates income from assets compared to the industry. A high sales-to-total-assets ratio indicates that the organization only needs to make a minimal investment to create sales, which raises the company's entire profitability.
On the other hand, a low or declining sales-to-total-assets ratio indicates that the organization will be required to expend more resources to produce adequate sales, which will lower the company's financial performance.
5. Financial Crisis of 2008
Certain asset-related securities' credit scores in 2007 were higher than they should have been. As a result, according to the Altman Z-score, the firms' risks were dramatically rising, and they might be on the verge of bankruptcy.
According to Altman's calculations, the average company's Altman Z-score in 2007 was 1.81. However, the credit scores of these firms were Bs. This showed that 50% of the companies should have received lower ratings, was in serious financial trouble, and had a high likelihood of going bankrupt.
According to Altman's estimates, the credit market would crash, and there would be a catastrophe. Furthermore, he assumed that company defaults would cause the catastrophe, whereas the collapse that caused the 2008 financial crisis started with mortgage-backed securities (MBS). Conversely, in 2009, companies quickly saw the second-highest rate of defaults on record.
6. The Altman Z-Score: How Should an Investor Interpret It?
Altman Z-score Plus is a tool investors can use to assess business credit risk. Organizations with ratings above 3 are less likely to file for bankruptcy than those with scores below 1.8, which indicates the likelihood of bankruptcy. If a stock's Altman Z-Score value is near 3, investors might think about buying it, and if it's closer to 1.8, they might think about shorting it and selling it. According to Altman, a number nearer to 0 than 1.8 suggests that a firm is on the verge of bankruptcy.
7. Did the 2008 Financial Crisis Predict the Altman Z-Score?
Altman's Z-score in 2007 showed that the firms' risks were dramatically rising. The average Altman Z-score for businesses in 2007 was 1.81, which is almost the cutoff point for a high likelihood of bankruptcy. According to Altman's predictions, a crisis resulting from company failures would happen, but the breakdown that caused the 2008 financial crisis started with mortgage-backed securities (MBS). Nevertheless, firms started defaulting in 2009 at the second-highest rate on record.
Conclusion
The Altman Z-Score is a popular measure with many uses. Among the numerous credit marking models currently in use, it combines quantitative financial measures with a constrained number of factors to aid in predicting a company's financial viability or entry into bankruptcy.
But since its inception, the Z-Score has become among the most accurate indicators of insolvency. Due to its numerous uses, this strategy is currently widely used by researchers. For instance, Altman reevaluated his tactics by looking at 86 distressed businesses from 1969 to 1975, 110 insolvent businesses from 1976 to 1995, and 120 insolvent businesses from 1996 to 1999. The Z-Score outperformed all other techniques in terms of Altman Z-Score accuracy, ranging from 82% to 94%.
But in this case, the adage "trash in, rubbish out" is true. Hence, the Z-Score will be incorrect and useless in our research and bankruptcy forecast if a company's financials or input data are deceptive or inaccurate.


 72.jpg)