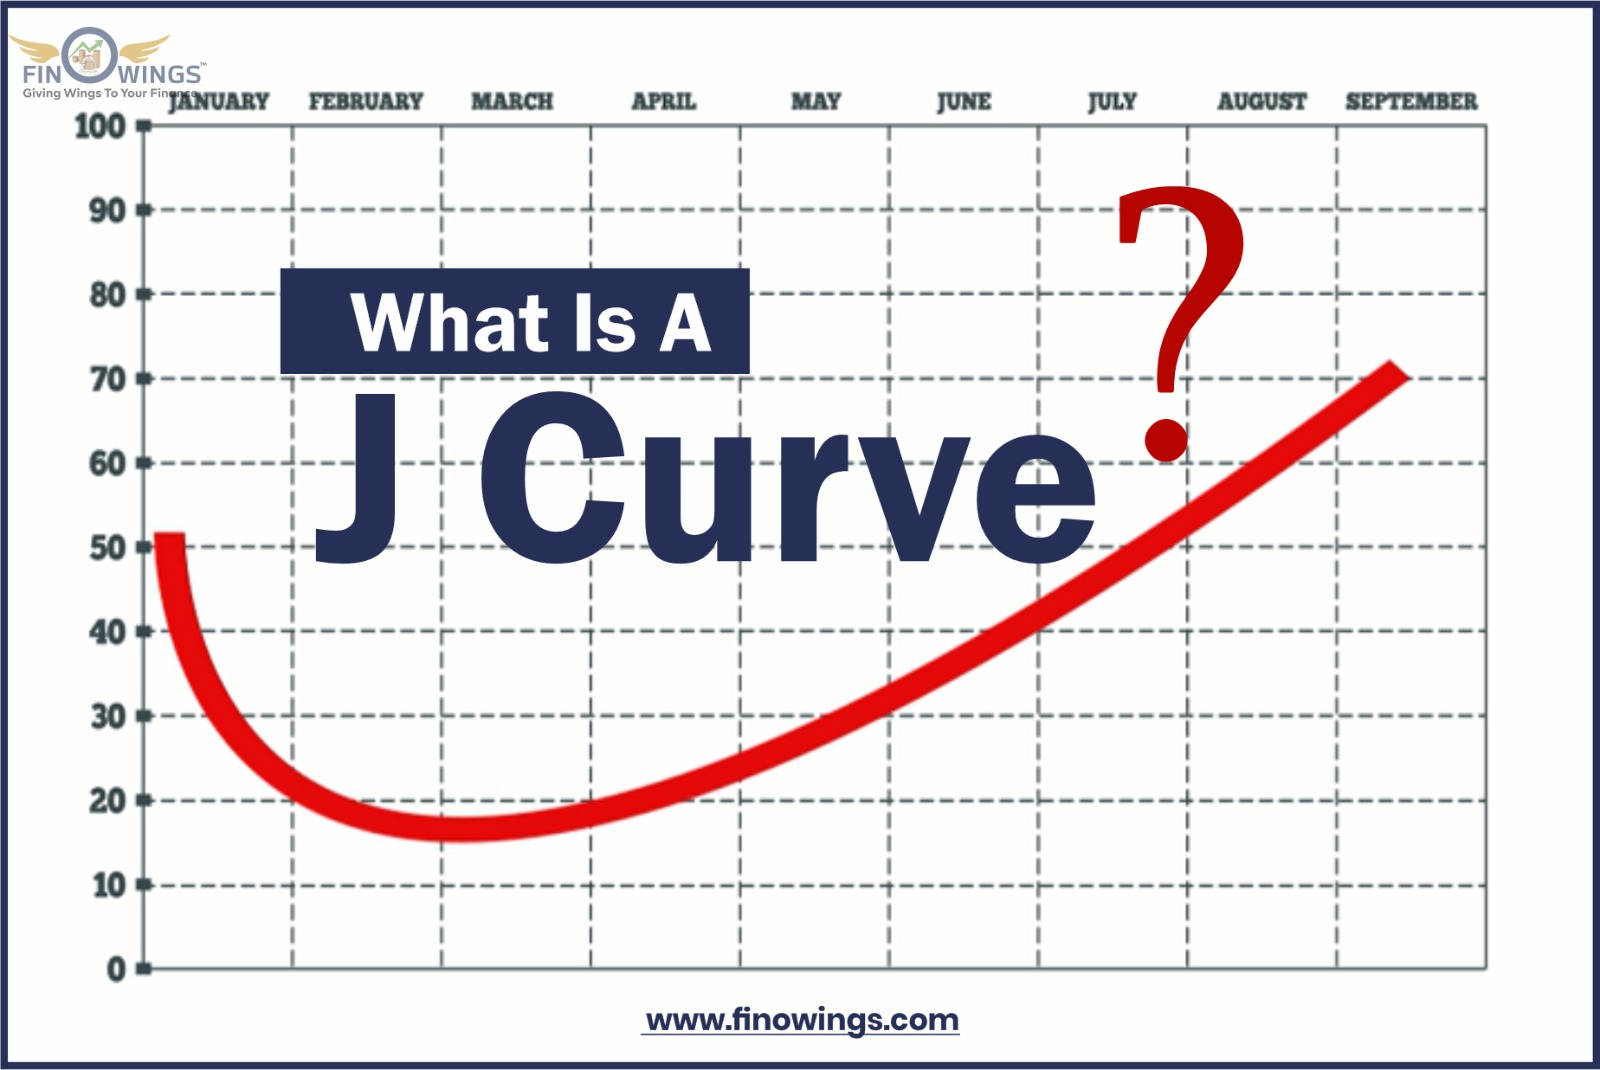
What Is a J Curve?
According to the economic theory known as the J Curve, a country's trade deficit will initially get worse if its currency depreciates. This is primarily because, in the short term, higher import prices will have a bigger impact on total nominal imports than the decreased number of imports. As a result, the nominal trade balance line graph that arises from this has a distinctive letter J shape.
The J-curve effect is frequently used in economics to explain phenomena like how a country's trade balance initially declines after a currency depreciation, swiftly improves, and finally outperforms its prior performance.

Recognizing a J Curve
The J Curve is based on the idea that because prices change before quantities, the trading volumes of imports and exports only gradually undergo microeconomic changes. As time passes, export volumes rise substantially due to their increased appeal to overseas consumers in terms of pricing. Due to their greater prices, domestic customers buy fewer foreign goods concurrently.
These concurrent acts finally caused the trade balance to change, showing a larger surplus (or smaller deficit) than before the devaluation. Naturally, the same economic theory also applies to opposite events; for instance, an inverted J Curve would come from a country's currency appreciation.
Even after a country's currency depreciates, the overall value of imports will probably rise, the fundamental reason for the delay between the depreciation and the reaction on the curve. However, the nation's exports remain unchanged until the existing trade agreements are fulfilled.
Large numbers of international consumers may eventually increase their purchases of goods that are imported into their country from the country with the weakened currency. These goods are now more affordable as compared to goods made domestically.
Balance Trade model

Under a specific set of assumptions, the "J curve" in economics represents the time course of a nation's trade balance following a devaluation or depreciation of its currency. For example, suppose the amounts of imports and exports move little initially. In that case, a depreciated currency makes imports more expensive, which results in a decline in the current account (a bigger deficit or smaller surplus). After some time, however, the volume of exports begins to increase due to their reduced cost to foreign customers, and domestic consumers purchase fewer imports due to their increased cost. As a result, the trade balance eventually shifts to a smaller deficit or a larger surplus than before the devaluation. Similar reasoning may be used in the event of currency depreciation or appreciation, resulting in an inverted J curve.
Imports will rise in value after a currency decline or devaluation, whereas exports will mostly stay the same, partly because pre-existing trade agreements must be upheld. This is because import prices rise in the short run due to depreciation, and in the short run, there is a lag in changing import consumption. As a result, there is an immediate increase followed by a lag until the long run prevails and customers stop importing as many expensive goods, which, together with the increase in exports, causes the current account to rise (a smaller deficit or an enormous surplus). Furthermore, demand for exports, which are less expensive to international buyers using foreign currencies, and the more expensive imports are both price inelastic in the near term. This is because the customer's search for suitable, less costly alternatives takes longer than expected (which might not exist).

A decline in the exchange rate over a more extended period is typically anticipated to improve the current account balance. As a result, domestic consumers turn away from the more expensive imported goods and services and toward domestic products. In addition, many international consumers might decide to stop buying domestically produced goods and services in favor of those being exported into their country because they are now less expensive in foreign currency.
The trade ratio, or exports divided by imports, rather than the trade balance, or exports minus imports, has occasionally been the subject of empirical studies of the J curve. Unlike the trade balance, the trade ratio can be changed logarithmically whether there is a trade surplus or deficit.
Asymmetric J curve

The asymmetric J-curve suggests that the changes in the currency rate and the trade balance may have an uneven relationship. The University of Wisconsin-Milwaukee economist Mohsen Bahmani-Oskooee first noted the asymmetric effects of real exchange rates on the trade balance. However, British economists Mary Leung and Muhammad Ali Nasir are credited with creating the phrase "asymmetric J-curve." In a paper on the US trade imbalance, they used cumulative dynamic multiplier analysis and presented empirical proof of an asymmetric J-curve.
Uses of J curve:
In Private Equity:

The J Curve in private equity depicts the propensity of private equity funds to post initial years of negative returns followed by later years of increasing returns as the investments mature. Investment charges, management fees, an underperforming investment portfolio written off in its early stages, and investments that have not yet reached maturity can all contribute to the initial negative returns on investments.
Private equity funds typically wait until they've found profitable assets before taking control of their investor's money. Then, the investors agree to give money to the fund manager as requested or as needed. Banks that provide financing to private equity funds bargain for a cash flow sweep, which mandates that the fund settle its debt with all or a portion of the extra cash flow produced.
The private equity fund produces little to no cash flow for the investors in the early years; instead, the initial funds are used to lower the company's leverage. An LBO model will need to be created for the deal by a financial analyst at a PE firm because this idea involves considerable financial modeling.
The fund will first experience unrealized profits, followed by occasions in which the gains are realized if correctly managed. Increased returns to the fund are produced through leveraged IPOs, mergers and acquisitions, and buyouts, which create the J Curve form. Any surplus funds will first be used to reduce debts before being distributed to equity investors.
The amount of profits generated and how quickly they are distributed to investors define the J Curve's inclination. While a curve with a leisurely climb symbolizes a poorly managed private equity fund that took too long to realize gains and only generated modest returns, a sharp curve represents a fund that generated the most considerable returns in the shortest time.
In Economics:
A J Curve in economics is a shift in the nation's trade balance, frequently following a devaluation of the currency or depreciation. A weak currency makes imports more expensive while making commodity exports more lucrative. A reduction in the current account due to the imbalance results in a smaller surplus or a more significant deficit.
There will be a lag in adjusting the usage of imports after a currency depreciation. However, as consumers search for less expensive options, the demand for pricey imports and the demand for affordable exports will remain unchanged in the short term.
The long-term effect of currency depreciation is that local customers will migrate to locally manufactured goods comparable to cheaper imports. Additionally, international traders will buy more goods that are being imported into their nation. Due to the depreciated value of their currency, the exports of goods to their country are significantly less expensive. At this point, the nation is seeing the desired improvement in the current account balance. When a nation's currency weakens and exports fall below the value of imports, the J Curve is created.
In Political Science
1. Revolution model:
The "J curve" is a component of a political science model that James Chowning Davies created to explain political revolutions. According to Davies, revolutions are a subjective reaction to relative deprivation, an abrupt turn in fortunes following a protracted period of economic progress. According to comparative deprivation theory, unmet expectations aid in overcoming the issue of collective action, which in this instance, can lead to an uprising. Frustrated expectations may result from several circumstances, such as rising inequality levels within a nation, which may mean that the poor are receiving less than they anticipated or a period of steady economic growth that raised expectations before a catastrophe.
This theory is frequently used to explain social and political turmoil and government measures to control it. Because an economic expansion followed by a downturn would be represented by an upside-down, slightly distorted J, this curve is known as Davies' J curve.
2. Country Status model:
The relationship between stability and openness is another "J curve." Ian Bremmer, the author of The J Curve: A New Way to Understand Why Nations Rise and Fall, first put forward this theory.

The 'openness' of the economy in question is represented by the x-axis of the political J-curve graph, while the y-axis represents the stability of the same state. It suggests that states that are "closed" or undemocratic or unfree (like the Communist dictatorships of North Korea and Cuba) are very stable; however, as one moves right along the x-axis, it is evident that stability (for relatively short periods in the lengthy life of nations) decreases, creating a dip in the graph. Stability then starts to pick up again as a state's "openness" increases; at the opposite end of the graph to closed states are the open states. Thus a J curve is formed.
Along this J curve, states can go ahead (right) and backward (left); hence stability and openness are never guaranteed. The curve is higher on the far right than the left because states that succeed in opening their societies—like Eastern Europe, for example—become more stable than authoritarian regimes. The J is steeper on the left because it is easier for a leader in a failed state to create stability by closing the country than to build a civil society and establish accountable institutions.
Depending on the relevant government's available economic resources, the entire Bremmer curve can move upward or downward. Accordingly, the relative stability of Saudi Arabia at each point along the curve changes in response to changes in the price of oil, whereas China's curve changes similarly in response to changes in the nation's economy.
In Medicine:
The term "J curve" in medicine describes a graph where the x-axis represents one of two symptoms that can be treated (blood pressure or blood cholesterol level), and the y-axis represents the likelihood that a patient would develop cardiovascular disease (CVD). High blood pressure and high cholesterol levels put patients at risk. Less known is that J-shaped plots of large populations against CVD mortality frequently show that patients with low blood pressure or low cholesterol levels are also at elevated risk.
Example of J curve
Following a sharp yen devaluation in 2013, Japan's trade balance declined, mainly because it took some time for the volume of exports and imports to adjust to price signals.
To overcome a deflationary situation, the Japanese government made significant currency acquisitions. However, due to energy imports and a lower currency, the nation's trade deficit increased to 1.3 trillion yen (US$12.7 billion).


 72.jpg)