1. Introduction
Investors frequently invest in debt securities, especially Bonds, by leveraging their financial strength. Given that they are debt instruments, they operate on the same basis as loans, in which a corporation issues bonds to obtain credit from the lender (also known as the bondholder). The business guarantees the lender a fixed, recurring interest rate on the principal sum.
This interest rate is known as a coupon in the context of bonds. Firms typically maintain debt instruments for a long time since the interest is paid on a routine basis, and they are required by law to pay the debt instrument holder. Therefore, a circumstance known as an "Inverted Yield Curve" may compel investors to make less money on long-term debt instruments than on short-term debt.
What causes this to occur? For example, do long-term debt instruments provide more significant returns than short-term ones?
This article provides essential information on preventing long-term debt investments from giving you lesser returns. But let's first examine instrument prices and yields. Bonds will be used as an instance of the preferable debt instrument in this context.
2. What Is a Yield Curve?
A yield curve can be created for any bond, from corporation to municipal. Considering the U.S. Treasury yield curve as an instance, let's go over the basics of yield curves.
Individuals typically give the government money when they purchase Treasury securities. This is a loan, to put it. In exchange, the Treasury guarantees that investors will receive their money back after a specific period (called maturity) and provides them with a fixed interest rate on loans, recognized as a coupon.
A U.S. Treasury bond yield will change over time, but the coupon won't. It is because yield explains the Treasurys' constantly shifting secondary market valuations.
A bond's yield to maturity, which includes coupon and principal repayment, is the rate of return on all cash flow generated by the bond. The bond cost has an inverse relationship with the yield to maturity. The bond's yield to maturity rises if the bond's cost falls.
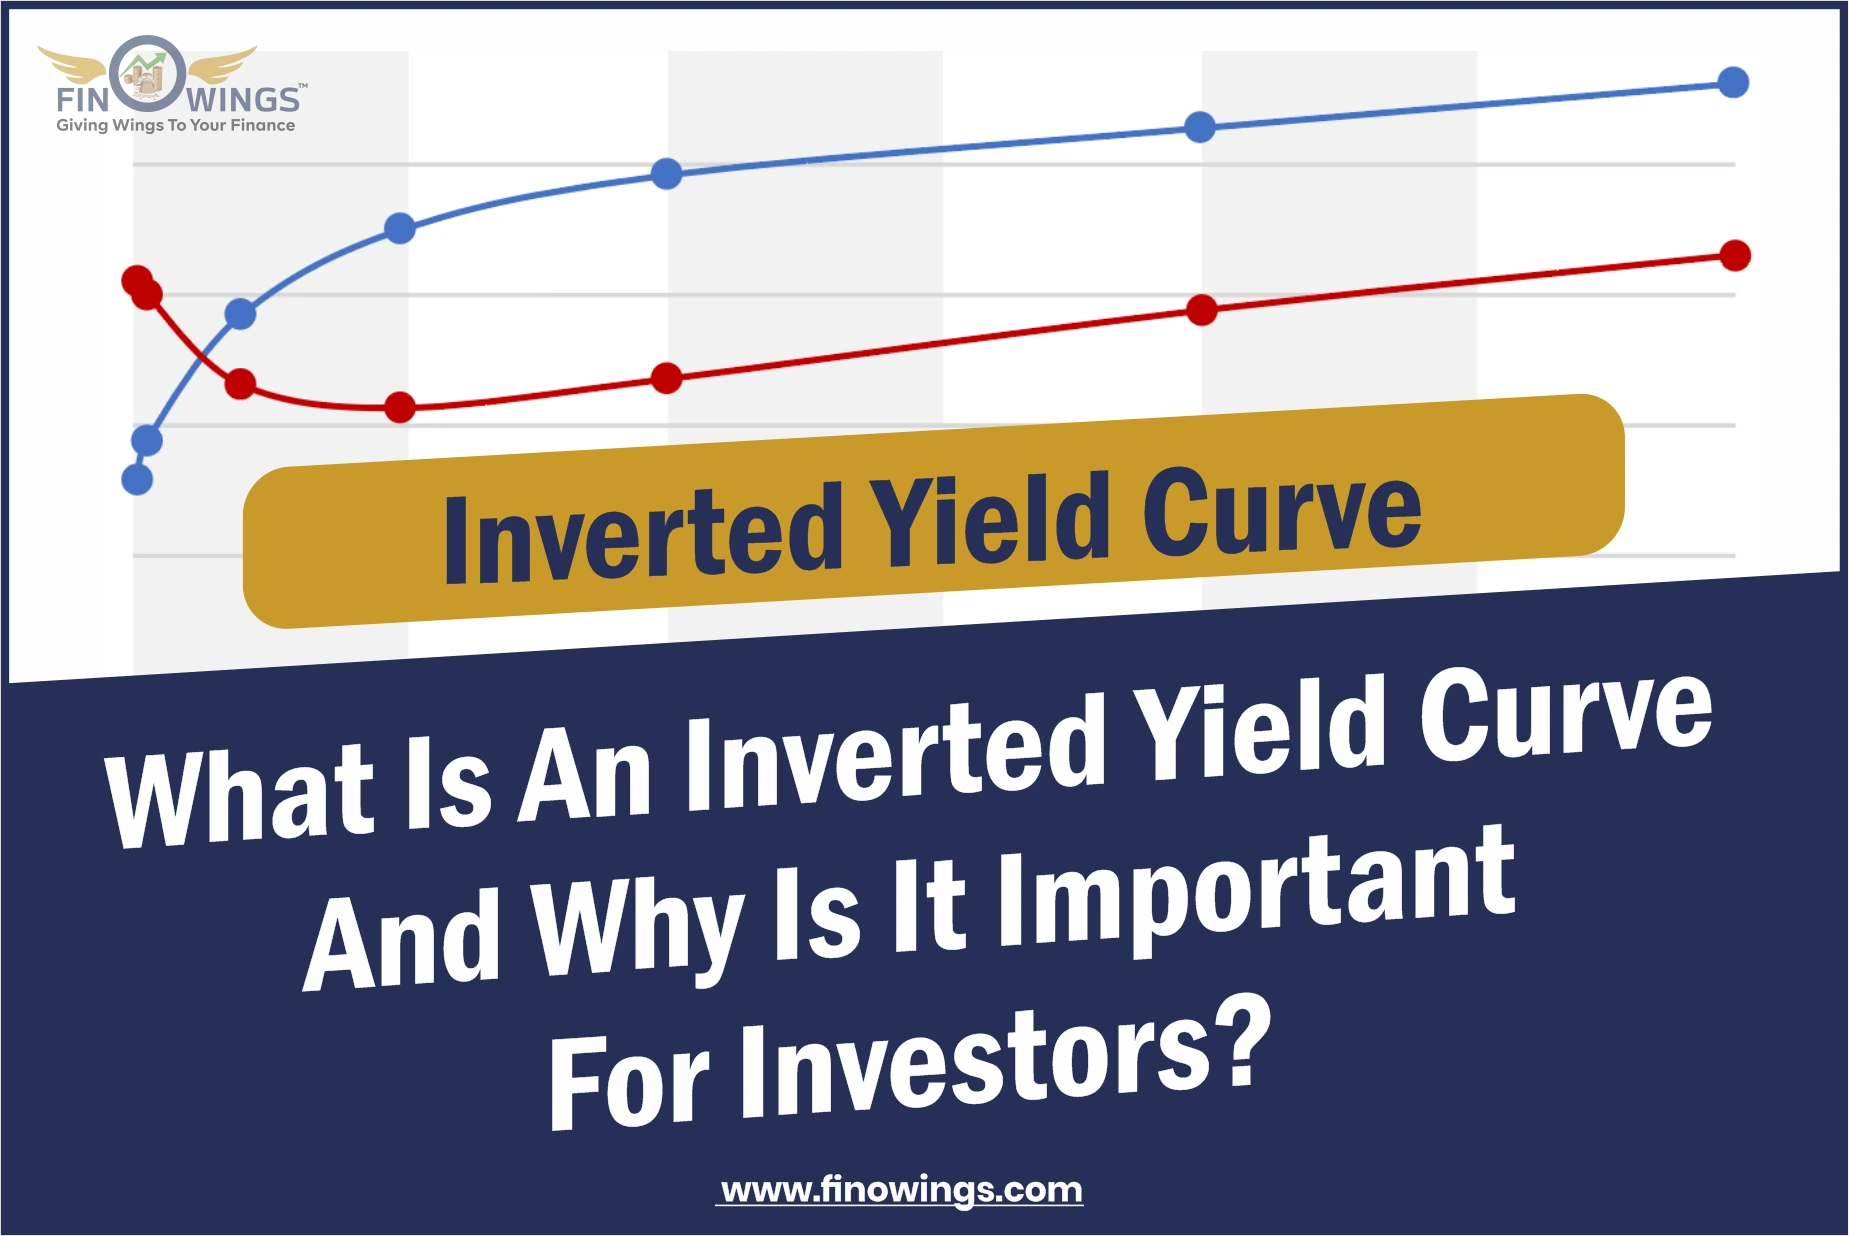
The horizontal X-axis on an X/Y graph represents maturity. The X axis starts on the left with short-term Treasury notes with maturities varying from a few days to a year, then progresses to Treasury notes with maturities varying from one to ten years, and finally settles down on the right with bonds with maturities varying from 20 to 30 years.
The vertical Y axis displays the present yield for each maturity, with lower yields at the bottom and greater yields at the top. An upward-sloping yield curve is typical. It is because investors require to be compensated mainly for their long-term investments. These investments carry a higher level of risk. Hence the yield must be higher.
3. Understanding the Inverted Yield Curve
According to a widely accepted financial theory, long-term debt instruments can provide investors with greater yields than short-term debt instruments. Therefore, this is reliant on outside variables and economic expansion. The yield curve calculates the correlation between risk and time to maturity. It is customary to use the benchmark 10-year bond everywhere in the globe when plotting the yield curve.
As a result, if you take the yield curve's X-axis, you start with a 1-year bond and work your way up to a 30-year bond. Naturally, investors want larger yields since the chance rises with bond maturity. The yield curve must, therefore, usually have an increasing slope.
For instance, a bond with a ten-year maturity will have a larger yield than one with a five-year maturity. The graph could, meanwhile, move lower due to potential economic variables like a recession, a rising unemployment rate, etc., rendering the short-term interest rates greater than the long-term interest rates. The term "inverted yield curve" refers to this downward, negative graph type.

4. The connection between an instrument's price and yield
-
Debt instruments are subject to supply and demand equilibrium, similar to most secondary market products. The yield on debt instruments is inversely correlated with the price of debt instruments.
-
For instance, if you own a bond with a face value of Rs 10,000, a 5-year maturity, and a 5% coupon rate, the bond will pay you Rs 500 in interest annually. Investors won't purchase your bonds anymore if market interest rates climb beyond 5%; instead, they will purchase new bonds with interest rates greater than 5%.
-
Consequently, you will need to lower the bond's cost to raise its yield. Because the bond's face value decreases as the cost is reduced, the coupon rate also rises, increasing the yield.
Interest rate increases, and the yield curve
The yield curve inverts and slopes downward when long-term interest rates surpass short-term interest rates. Due to the danger and unpredictability of the share market shortly, long-term investors participate in longer-term bonds. They would instead secure a yield by purchasing a long-term bond than take the chance of damaging money by buying more erratic shares.
The narrowing yield causes a flattened yield curve spread among short- and long-term loan rates—the cost of the bond changes in step with these occurrences. For example, the bond cost will increase if the bond has a three-year maturity and the three-year yield decreases. Bond prices adjust to maintain parity with fluctuating interest rates and current bonds on the secondary market.
Although interest rates and inflation are expected to remain low for some time, flattening the yield curve may signify economic weakness. The economy is expected to develop modestly while bank lending is declining.
The spread among the interest rates on short-term and long-term bonds widens as the yield curve steepens. In other words, long-term bond yields are rising quicker than short-term bond yields, or vice versa, with short-term bond yields falling and long-term bond yields, rising. As a result, the cost of long-term bonds will decrease relative to the price of short-term bonds.
An upward-sloping graph typically denotes more economic expansion and inflationary concerns, translating into higher lending rates. Instances of a steepening yield curve are a 2-year note with a yield of 1.5% and a 20-year note with a yield of 3.5%.
5. Examples of Inverted Yield Curves in the Past
-
Since giving a false positive in the mid-1960s, the 10-year to two-year Treasury spread has been a largely reliable harbinger of recessions. But, unfortunately, that has yet to stop a long line of renowned American economists from underestimating its prognostication abilities over time.
-
Following the Russian debt failure in 1998, the 10-year/two-year spread briefly reversed. The Federal Reserve's swift interest rate reductions assisted in preventing a U.S. recession.
-
For most of the year in 2006, the spread was inverted. In 2007, shares underperformed long-term Treasury bonds. Then, in December 2007, the Big Recession officially started.
-
The 10-year/two-year spread momentarily became negative on August 28, 2019. The COVID-19 outbreak, although it could not have been a factor in bond prices six months earlier, caused the U.S. economy to experience a two-month recession in February and March 2020.
6. What role do invert yield curves have in recession prediction?
A slowing in economic development has accompanied each yield curve inversion over the past 50 years if empirical information is any guide. Researchers and professionals utilize an inverted yield curve to predict a recession due to this consistent historical connection. They can predict a drop in interest rates if they observe that the yield curve, which was formerly positive, is now inverted and moving downward. A recession usually nearly follows an inverted yield curve since a recession also causes a substantial decline in interest rates.
7. What may a yield curve that has inverted reveal to investors?
The state of a nation's economy is intimately correlated with the yield curve's form. The yield curve will be upward-sloping if it is anticipated that the nation's economic growth will remain positive. Therefore, the yield curve would be inverted and have a downward slope if the economy is in a bad situation and is expected to worsen. Investors can then begin to evaluate their holdings, particularly debt, and make adjustments in anticipation of an impending recession and decline in interest rates.
Conclusion
The status of an economy affects debt instruments significantly. For example, investors can use the inverted yield curve to forecast a dramatic decline in interest rates and an impending recession because these economic variables influence interest rates in some way. Therefore, it is advisable to make the necessary adjustments to the investments as soon as the yield curve becomes negative because the future may present a significant risk to the investors.


.jpg)