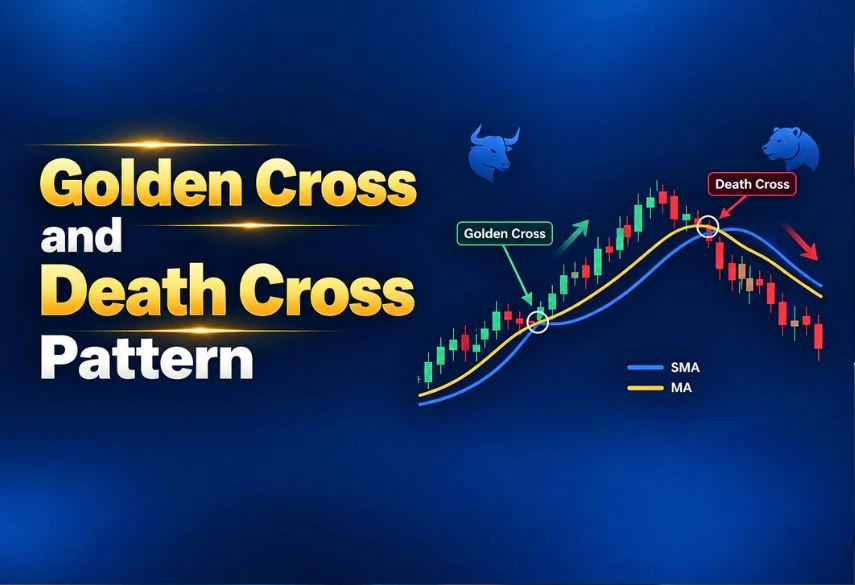
Double Top and Bottom Patterns are two of the most reliable reversal signals in technical analysis. A double top pattern forms after an uptrend and looks like the letter “M.” It warns that buyers are losing strength and a downward move is likely.
A double bottom pattern forms after a downtrend and looks like the letter “W.” It signals that sellers are exhausted and an upward move may begin. Both patterns become valid only when price breaks the neckline with confirmation.
These classic chart patterns appear on stocks, forex, crypto, and indices. Traders use them for clear entry, stop-loss, and target levels. This guide explains double top and double bottom in simple language so beginners can identify, confirm, and trade them with confidence.
What Is a Double Top Pattern?
A double top pattern is a bearish double top reversal pattern. Price rises to a high, pulls back, then rises again to nearly the same high but fails to break higher. The two peaks form an “M” shape. This is also called M pattern trading.
The low point between the two peaks is the double top neckline. The pattern completes only when price closes below this neckline. Until that break happens, it is only a potential double top.
Key features of a valid double top chart pattern:
-
Clear prior uptrend
-
Two peaks at roughly the same price level (usually within 1–3%)
-
A meaningful pullback between the peaks
-
Lower volume on the second peak in many cases
-
Neckline break on increased volume.
According to Britannica Money, double tops and bottoms are classic reversal patterns that show when a trend may be losing momentum.

What Is a Double Bottom Pattern?
A double bottom pattern is the bullish mirror image. After a downtrend, price falls to a low, bounces, then falls again to nearly the same low and holds. The two lows form a “W” shape. This is known as W pattern trading.
The high point between the two lows is the neckline. The pattern confirms when price closes above this neckline. This is called a double bottom breakout.
Key features of a valid double bottom chart pattern:
-
Clear prior downtrend
-
Two lows at roughly the same price level
-
A bounce between the lows
-
Often lighter volume on the second low
-
Strong volume on the breakout above the neckline.
StockCharts and other technical analysis sources note that bottoms often take longer to form than tops, and volume plays a more important role in confirming double bottoms.
Double Top vs Double Bottom: Clear Comparison
|
Feature |
Double Top Pattern |
Double Bottom Pattern |
|
Shape |
M |
W |
|
Prior Trend |
Uptrend |
Downtrend |
|
Signal |
Bearish reversal |
Bullish reversal |
|
Neckline |
Low between two peaks |
High between two lows |
|
Confirmation |
Close below neckline |
Close above neckline |
|
Common Nickname |
M pattern trading |
W pattern trading |
|
Typical Stop Loss |
Above the second peak |
Below the second low |
|
Measured Target |
Pattern height projected downward |
Pattern height projected upward |
This table shows the core double top vs double bottom differences at a glance.
How to Identify a Double Top Pattern
Learning how to identify a double top pattern starts with these simple steps:
1. Look for a clear uptrend lasting several weeks or months.
2. Mark the first peak (resistance).
3. Watch the pullback that forms the future neckline.
4. Wait for the second peak to form near the same price level.
5. Draw a horizontal line at the lowest point between the two peaks (the neckline).
The two peaks should not be too close in time. A gap of several candles (or days on higher timeframes) makes the pattern more reliable. Many traders also look for lower volume on the second peak as a sign that buying pressure is fading.
How to Confirm a Double Top Pattern
Two peaks alone are not enough. Knowing how to confirm a double top pattern is critical.
The pattern is confirmed only when price closes below the double top neckline. A simple wick below the line is not enough. Many experienced traders wait for a full candle close.
Extra confirmation signals include:
-
Higher volume on the neckline break
-
Bearish divergence on RSI or MACD
-
Rejection candles at the second peak.
Until the neckline breaks, treat the formation as only a potential double top. Premature entries cause many losses.
How to Trade Double Top (Double Top Pattern Strategy)
Here is a practical double top pattern trading approach:
Entry
Enter short on the close below the neckline or on a retest of the broken neckline from below.
Stop Loss
Place the stop just above the second peak (or the higher of the two peaks).
Target (Double Top Pattern Target)
Measure the height from the peaks to the neckline. Project the same distance downward from the neckline. This is the classic measured move target.
Example
Peaks at 100, neckline at 90 → height = 10. Target = 90 – 10 = 80.
Many traders take partial profits at the target and trail the rest. Always size the position so that the risk to the stop is only 1% or less of your account.
How to Trade Double Bottom (Double Bottom Pattern Strategy)
The double bottom pattern trading rules are the reverse:
Entry
Enter long on the close above the neckline (double bottom breakout) or on a retest of the neckline from above.
Stop Loss
Place the stop just below the second low (or the lower of the two lows).
Target (Double Bottom Pattern Target)
Measure the height from the lows to the neckline. Project the same distance upward from the neckline.
Example
Lows at 50, neckline at 60 → height = 10. Target = 60 + 10 = 70.
Volume is especially important here. A strong surge in volume on the breakout adds confidence.
Role of Volume in Both Patterns
Volume helps separate strong patterns from weak ones.
In a classic double top pattern:
-
Higher volume on the first peak
-
Lower volume on the second peak
-
Expanding volume on the neckline break.
In a classic double bottom pattern:
-
High volume on the first low (panic selling)
-
Lower volume on the second low (seller exhaustion)
-
Strong volume on the breakout.
Volume is supporting evidence, not a strict requirement. Some valid patterns work without perfect volume signatures.
Common Mistakes Beginners Make
1. Entering before the neckline break
2. Ignoring the prior trend
3. Using peaks or lows that are too far apart in price
4. Placing stops too tight
5. Forcing the pattern on every chart
Patience is the real edge. Wait for confirmation.
Practical Tips for Double Top and Bottom Patterns
-
Prefer higher timeframes (daily or 4-hour) for cleaner signals.
-
Combine with support/resistance or moving averages for better confluence.
-
Keep a trading journal of every double top and double bottom you take.
-
Remember that no pattern works 100% of the time. Risk management always comes first.
These chart patterns, double top and double bottom setups, remain popular because they offer clear structure and measurable targets. When used with discipline, technical analysis double top and double bottom strategies can improve consistency.

Conclusion
Double Top and Bottom Patterns give traders a clear roadmap. The double top pattern warns of potential weakness after an uptrend. The double bottom pattern signals possible strength after a downtrend. Both become actionable only after the neckline break.
Focus on proper identification, wait for confirmation, manage risk strictly, and treat every trade as one of many. With practice, how to trade a double top and how to trade a double bottom becomes a natural part of your technical analysis toolkit.
Stay patient, stay disciplined, and let the chart confirm the pattern before you act.
(Sources: Britannica Money , ChartingLens , LuxAlgo , StockCharts)

DISCLAIMER: This blog is NOT any buy or sell recommendation. No investment or trading advice is given. The content is only for educational purposes. Always discuss with your SEBI-registered financial advisor for investment-related decisions.
Follow this WhatsApp Channel for the latest updates directly on WhatsApp.




.webp "paper-trading-neostox-tradingview")