Golden cross and death cross are useful lagging indicators that confirm trends already underway, but they do not reliably predict the future on their own. Historical data shows the golden cross on the S&P 500 has been followed by positive 12-month returns roughly 75–82% of the time, while the death cross often fails as a pure sell signal and is frequently followed by rebounds.
They work best as part of a broader strategy with volume, momentum, and risk management - not as standalone buy or sell triggers.
If you are new to the stock market or crypto, you have almost certainly heard people talk about the golden cross and the death cross.
These two phrases appear in news headlines, YouTube videos, and trading forums whenever big indices like the S&P 500 make a major move.
Traders get excited when a golden cross appears and nervous when a death cross forms. But the real question most beginners ask is simple: does a golden cross work, and does a death cross work?
This guide answers that question in clear, beginner-friendly language. You will learn exactly what these signals mean, how they form, what the historical patterns actually show, and how to use them without making common mistakes.
Everything is written in simple words so anyone can follow along, even if this is your first time studying charts of Nifty 50 or Sensex.
Why These Signals Matter to Everyday Traders
The Indian stock market can feel confusing when you start. Prices of Nifty 50, Sensex, and individual stocks go up and down every day. News comes and goes. It is hard to know when a real trend has started or when a move is just temporary noise. The golden cross and death cross try to solve that problem by using two simple lines on a chart.
These lines are called moving averages. They smooth out the daily ups and downs so you can see the bigger picture. When the shorter line crosses the longer line, it creates a visual signal that many people watch. That is why the golden cross and death cross stock market discussions get so much attention.
Even big institutions and professional traders keep an eye on these crosses. The same is true for the Bitcoin golden cross and Bitcoin death cross. Understanding these signals helps you read the market more calmly instead of reacting to every headline.

Understanding Moving Averages in Simple Words
Before we talk about the crosses, you need to understand the two lines that create them. A moving average is just the average price of a stock or index over a certain number of days. It “moves” because it is recalculated every day with the newest price.
The two most common ones used for these signals are:
-
The 50-day simple moving average (SMA). This takes the closing prices of the last 50 trading days and averages them.
-
The 200-day simple moving average (SMA). This does the same thing for the last 200 trading days.
The 50-day average reacts faster because it only looks at recent prices. The 200-day average moves more slowly because it includes a much longer period. When these two lines cross each other, we get either a golden cross or a death cross. This is the classic 50 day 200 day moving average setup, also called a 50/200 MA crossover or moving average crossover.
Think of it like this: the 50-day line is a short-term friend who changes opinions quickly. The 200-day line is a long-term friend who is slower to change. When the short-term friend becomes more positive than the long-term friend, that is a golden cross. When the short-term friend becomes more negative, that is a death cross.
What Is a Golden Cross? Full Beginner Explanation
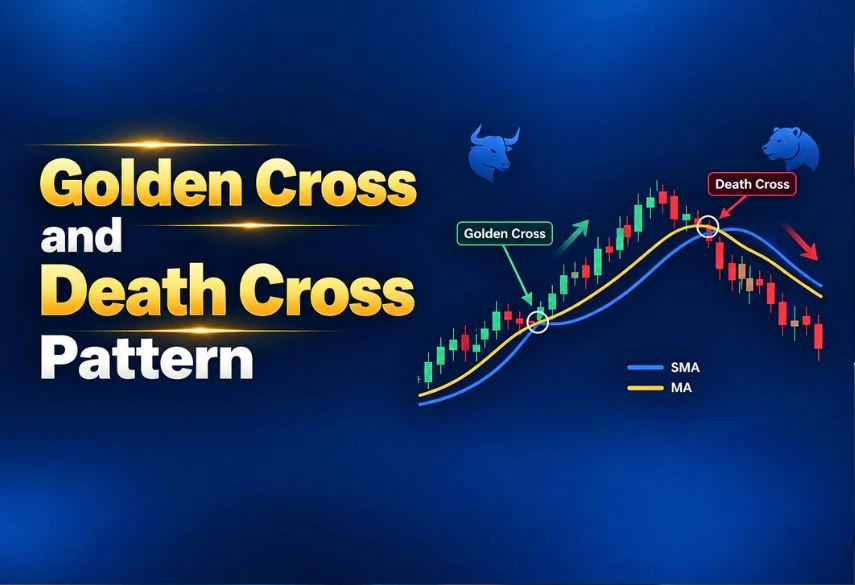
A golden cross happens when the 50-day moving average crosses above the 200-day moving average. The golden cross means that recent prices have become stronger than the longer-term average. Traders see this as a sign that an uptrend may be in place.
The signal usually appears after a period of weakness. First, the market falls. Then it starts to recover. As prices rise, the 50-day average turns up and eventually climbs above the 200-day average. At that moment, the golden cross is complete.
Because the averages are based on past prices, the moving average golden cross is always late. By the time the lines cross, the market has often already risen 10% to 25% from its lowest point. That is why people call it a lagging indicator. It confirms a trend that has already started rather than predicting the exact bottom.
You will see the golden cross discussed on Nifty 50, Sensex, individual golden cross stocks listed on NSE and BSE, and even in related markets. Many Indian traders use it as a filter. They prefer to look for buy opportunities only when the 50-day average is above the 200-day average.
What Is a Death Cross? Full Beginner Explanation
A death cross is the opposite event. It forms when the 50-day moving average crosses below the 200-day moving average. The death cross means that recent prices have become weaker than the longer-term average.
The name sounds scary, and media headlines often treat it as a warning of big trouble ahead. In practice, it is also a lagging signal. The market has usually already fallen a meaningful amount before the cross appears. Sometimes the death cross arrives near a low point rather than at the start of a new major decline.
Just like the golden cross, the death cross is watched on the death cross stock market, Nifty 50, Sensex, and individual stocks. Some traders use it as a reason to reduce long positions or tighten their stop-loss levels. Others treat it more carefully because history shows many death crosses are followed by rebounds in the Indian market as well.
Golden Cross vs Death Cross: Clear Comparison Table
Here is a simple table that shows the main differences:
|
Feature |
Golden Cross |
Death Cross |
|
How it forms |
50-day MA crosses above 200-day MA |
50-day MA crosses below 200-day MA |
|
What it suggests |
Recent strength is stronger than the long-term trend |
Recent weakness is stronger than the long-term trend |
|
Typical market mood |
Bullish confirmation |
Bearish confirmation |
|
When it usually appears |
After a bottom has formed |
After a top has formed |
|
Common trader reaction |
Look for long opportunities |
Reduce exposure or look for short setups |
|
Biggest weakness |
Arrives late; can give false signals in sideways markets |
Arrives late; often appears near market lows |
|
Best use |
Trend filter for buying |
Risk management tool |
Both signals come from the same 50-day and 200-day moving average system. The only difference is the direction of the cross.
How the Signals Form: Step-by-Step for Beginners
Understanding the three stages helps you avoid buying or selling too early.
For a golden cross:
1. The market has been falling or moving sideways. The 50-day average is below the 200-day average.
2. Prices start rising. The 50-day average turns upward and begins to catch up.
3. The 50-day average crosses above the 200-day average. This is the official golden cross moment. Ideally, volume is higher than normal and the 200-day average is flattening or turning up.
For a death cross:
1. The market has been rising. The 50-day average is above the 200-day average.
2. Prices start falling. The 50-day average turns down.
3. The 50-day average crosses below the 200-day average. This creates the death cross. Higher volume on the downside can make the signal stronger.
These steps apply to stocks, indices, and Bitcoin. The process is the same; only the speed and size of the moves change.
Do They Actually Work? Looking at the Real Numbers
This is the most important section. Many people ask: does a golden cross work, and does a death cross work? The honest answer is that they work partially, not perfectly.
Studies that look at decades of S&P 500 data show these patterns:
- After most golden crosses, the market was higher 12 months later in about 75% to 82% of cases. Average gains often landed between 10% and 15%.
- The golden cross success rate looks good at first glance. But the stock market rises in most years anyway. So the extra edge from the signal alone is usually small.
- After death crosses, the market was higher 12 months later in roughly 60% to 70% of cases. The death cross success rate as a pure sell signal is weaker.
- A strategy that buys on every golden cross and sells on every death cross has often produced returns close to simple buy-and-hold, sometimes with smaller drawdowns during bad periods.
- The signals perform better when used as filters rather than exact entry and exit points.
Here is a simplified summary table based on historical observations of the S&P 500:
|
Signal |
Typical 12-Month Positive Rate |
Average Behavior |
Key Observation |
|
Golden Cross |
75–82% |
Modest positive edge over random days |
Confirms uptrend already underway |
|
Death Cross |
60–70% higher later |
Often followed by rebounds |
Poor pure short signal on major indices |
|
Buy-and-Hold |
Around 70–75% of years higher |
Steady long-term rise |
Hard to beat consistently with timing |
These numbers explain why the signals are popular but not magic. They describe what has already happened more than they predict what will happen next.
Practical Golden Cross Strategy for Beginners
A basic golden cross strategy or golden cross trading strategy can be built with clear rules:
1. Wait for the 50-day average to cross above the 200-day average on Nifty 50, Sensex, or your chosen stock.
2. Check that volume on the crossover day is higher than the recent average. Higher volume shows more conviction.
3. Make sure price is closing above both moving averages.
4. Prefer situations where the 200-day average is no longer falling steeply.
5. Do not buy the exact cross day if price has already jumped a lot. Wait for a small pullback toward the 50-day average.
6. Place a stop-loss below the 200-day average or a recent low.
7. Consider taking partial profits after a strong move or when the 50-day average starts to flatten.
This approach turns the "how to trade golden cross" question into a simple checklist. It reduces the chance of chasing late moves and helps manage risk.
Practical Death Cross Strategy for Beginners
A careful death cross strategy, or death cross trading strategy, looks different:
1. When the 50-day average crosses below the 200-day average on Nifty 50 or Sensex, review your long positions.
2. Tighten stop-losses or reduce position size if the overall market looks weak.
3. Avoid opening new long trades while the death cross is active, especially if volume is high on the downside.
4. Do not automatically short every death cross on major indices. History shows many of them reverse.
5. Use the signal more as a risk-management alert than as a high-confidence short entry.
This conservative approach protects capital without forcing you into trades that often fail.
Common Mistakes Beginners Make
Many new traders treat the golden cross as a guaranteed buy and the death cross as a guaranteed sell. This leads to problems. The signals are lagging. Buying right at the golden cross often means paying a higher price. Selling right at the death cross can mean selling near a low.
Another common mistake is ignoring the market environment. In a strong long-term bull market in India, death crosses are more likely to fail. In a deep correction, golden crosses may reverse quickly. Always look at the bigger picture of Nifty 50 and Sensex.
Trading every cross in a sideways market is also dangerous. When price moves sideways, the two averages can cross multiple times and create many false signals. Waiting for clearer trends improves results.
Using the Signals on Different Markets
The same 50/200 MA crossover rules work on individual golden cross stocks, broad indices, and Bitcoin. Results are not identical.
On Nifty 50 and Sensex the signals benefit from the long-term growth of the Indian economy. Individual stocks can show cleaner trends when volume confirms the move, but they also carry company-specific risk. Always test the idea on the specific stock or index you trade.
Combining Golden Cross and Death Cross with Other Tools
The signals become more useful when combined with simple extra checks:
Volume: Higher volume on the crossover day adds confidence.
Price structure: Higher highs and higher lows support a golden cross. Lower highs and lower lows support a death cross.
Momentum indicators such as RSI: Readings above 50 can support bullish crosses; readings below 50 can support bearish ones.
Broader market health: It is safer to act on individual stock crosses when the overall market is also aligned.
These extra filters turn a basic lagging indicator into a more complete decision process.
Limitations and Risks You Must Accept
No technical signal is perfect. The golden cross and death cross are no exception. They lag. They produce false signals. They do not tell you how far price will move or how long a trend will last. Trading costs, taxes, and emotions also reduce real-world results compared with pure historical numbers.
Risk management is more important than any single signal. Always decide in advance how much you are willing to lose on a trade. Never risk money you cannot afford to lose.
A Simple Checklist Before You Act
Before you trade any golden cross or death cross, ask yourself these questions:
Has the 50-day average clearly crossed the 200-day average?
Is volume supporting the move?
Is the 200-day average flattening or turning in the direction of the cross?
Does price structure confirm the new trend?
Do I have a clear stop-loss level?
Am I treating this as one piece of information, not a complete strategy?
If the answers are mostly yes, the signal has more value. If many answers are no, it is safer to wait.

Conclusion
The golden cross and death cross are popular because they are simple and visual. They help beginners see when the medium-term trend has shifted relative to the longer-term trend. Used alone, they have limited power. Used as part of a careful process that includes volume, structure, and risk control, they can still be helpful tools.
Focus on understanding what the 50 day 200 day moving average relationship is telling you. That calm approach is more valuable than reacting to dramatic names in the news. Study historical examples, practice on charts without real money first, and always protect your capital. Over time, you will develop a clearer sense of when these signals deserve attention and when they should be ignored.
(Sources : YX Insights, Quantified Strategies, Strike.money ,Kagels Trading)

DISCLAIMER: This blog is NOT any buy or sell recommendation. No investment or trading advice is given. The content is only for educational purposes. Always discuss with your SEBI-registered financial advisor for investment-related decisions.
Follow this WhatsApp Channel for the latest updates directly on WhatsApp.









.webp)