For each investor or trader, the comprehension of market sentiment and the analysis of price movement is vital. Elliott Wave Theory is a key component of technical analysis and market prediction, and a major piece of insight to analysis.
The price of stocks and other financial instruments is determined in part by the psychological state of the market. They rise and fall in a Predictable Repetitive Cycle. Let’s examine technical analysis Elliott Wave Theory, its insights, principles, patterns, and how it is employed for advanced prediction of the market.
What Is Elliott Wave Theory? (Elliott Wave Theory Definition)
The Elliott Wave Theory is a financial market cycle analysis pioneered and named after Ralph Nelson Elliott in the 1930s. It is the only other analysis, besides fundamental analysis, that captures the market sentiment of the investor. Each investor cycle, optimism, fear, and greed result in distinct and predictable price movements.
In essence, and in more valid terms, Elliott Wave Theory captures and explains the complexity of market movement and the factors that result in the market fractals.
Understanding the Basics of Elliott Theory
Elliott Theory states that price trends can be tracked and a pattern can be followed in a larger market cycle. These can be used in predicting price directions in a market and possibly what price will be in the future.

Relaying the Basis of Wave Theory
Elliott identified and documented all the necessary market price movements that can take place in repetitive cycles and can be classified as impulses and corrections. These movement cycles are what form the Elliott Wave Principle.
Based on the Elliott Wave Principle, the Elliott Wave Principle key to market behaviour, showing that the price in a market will take a complete cycle of movement in the form of five waves and will then be followed by a correction in a counter movement of three waves.
In this complete cycle, the five-wave construction will be the main moving pulse and the three waves counter will be the correction pulse.
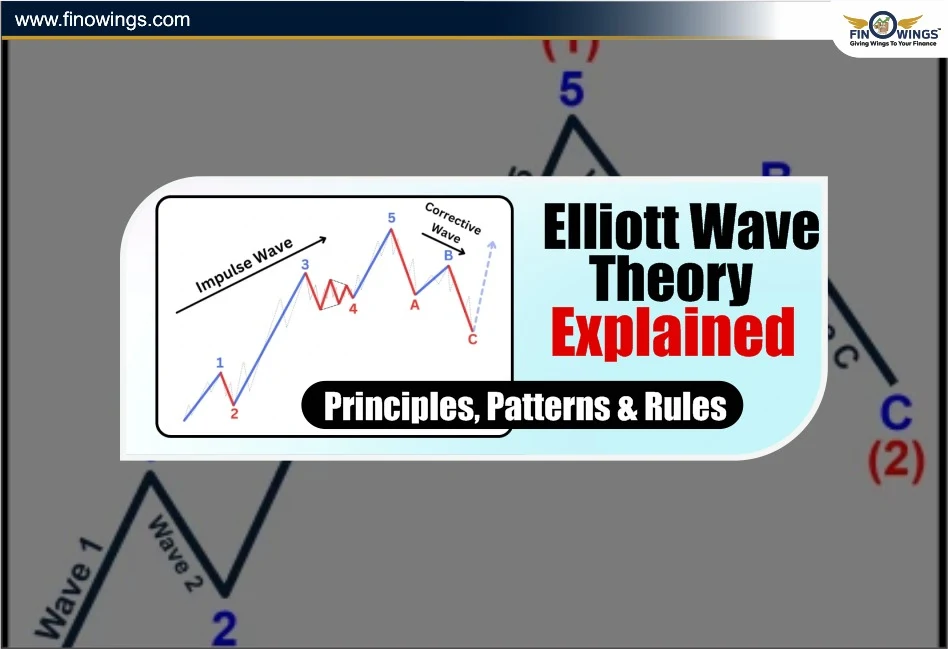
Elliott Wave Pattern
Impulse Waves (1–5): These movements will be in the direction of the main trend.
Corrective Waves (A–B–C): These movements will counter the trend of the main direction.
Being under Bullish Market conditions:-
-
Waves 1, 3, and 5 show upward impulses.
-
Waves 2 and 4 show downward corrections.
-
After this, an A-B-C correction phase occurs before the next major trend begins.
-
This repetitive structure forms the essence of stock market wave theory.
Elliott Wave Principle: Key to Market Behavior
Elliott wrote that emotions - particularly human and market emotions - behave in rhythmic and predictable cycles in his book "The Elliott Wave Principle: Key to Market Behavior."
These cycles and patterns correspond to and are as predictable as tides, changes in season, and biological cycles, demonstrating that market ‘randomness’ is a product of collective human psychology.
Understanding the 5-3 Wave Cycle
Using Elliott’s 5-3 Wave Cycle as an example, we can better understand the Elliott Wave Pattern.
Wave 1: A small section of the market invests and buys.
Wave 2: The prices retreat as a result of early profit-taking, however prices cannot fall back below the starting prices.
Wave 3: The rally expands and mainstream investors take the prices to a new high. This is the longest wave.
Wave 4: Small rally as profit-taking occurs.
Wave 5: The late investors pour in even more to raise prices in euphoria.
The A-B-C Correction follows the five-wave advance.
Wave A: Losing early sellers.
Wave B: Inevitably, prices rally, however selling returns.
Wave C: The selling picks up again to complete the correction.
These patterns are endless and demonstrate the unswerving psychology of human markets.
Elliott Wave Guidelines
Each trader utilising wave theory should follow a few Elliott Wave rules to confirm proper identification and interpretation:
1. Wave 2 cannot retrace more than 100% of Wave 1. If it does, it invalidates the wave count.
2. Wave 3 cannot be the shortest of Waves 1, 3, and 5. It is usually the strongest and longest wave.
3. Wave 4 cannot overlap the price territory of Wave 1. This ensures a proper impulsive structure.
These three Elliott Wave rules are non-negotiable; any analysis that breaks one of these rules must be reset.
Elliott Wave Patterns
The Elliott Wave model comprises several sub-patterns that manifest during impulses and corrections.
1. Impulse Waves
These are extremely powerful movements that align with the existing trend. An impulse wave is made of five smaller waves with waves 1, 3, and 5 moving strongly in the trend’s direction, while 2 and 4 are minor corrective waves.

2. Diagonal Waves
These are found at the beginning or end of a trend. Diagonal waves structure resembles wedges and can be found in both upward and downward markets.

3. Corrective Waves
Corrective Waves consist of 3 wave patterns working against the main trend. These patterns are classified as:-
Zigzag corrections

Flat corrections

Triangle corrections

Each behave differently while following their respective internal wave counts.
(Chart Sources: Tradingview)
Elliott Wave Theory of Technical Analysis
In technical analysis, traders utilise the Elliott Waves to determine:
- Trends within a market
- Market reversals
- Entry and exit points
- Price targets within a trend structure
Using the current wave counts, traders determine where the market is within the cycle - accumulation, expansion, or correction.
In the present day, analysts use the Elliott Wave Theory combined with other tools to increase effectiveness. These tools include Fibonacci retracements, RSI, and moving averages.
Elliott Wave Chart Example
Take, for example, the case of a stock that increases in price from ₹100 to ₹160 in five stages, and then decreases back to ₹130 in three stages.
If you plotted this using a DuPont chart-like structure, you would see a 5–3 Elliott Wave pattern. This gives you proof of the cyclical behaviour of the market.
This is extremely useful as traders are able to determine where the next move is likely to occur within the Elliott Wave pattern.
How Traders Use the Elliott Theory
1. Identify the Current Wave: Find out if the market is an impulse or a correction.
2. Apply the Elliott Wave Principles: Count the sub-waves and check if the rules are fulfilled.
3. Project Price Targets: Use Fibonacci ratios: 38.2%, 50%, and 61.8% to find support or resistance zones.
4. Confirm with Volume and Indicators: Volume tends to increase and decrease with impulsive and corrective waves, respectively.
This organised approach enables traders to flow with the market instead of going against it.
Limitations of Elliott Wave Theory
-
Elliott Theory offers considerable insight, but it isn't without pitfalls:
-
Wave counting is subjective, and so is interpretation.
-
Elliott Theory works best with trending markets; sideways markets pose limitations.
-
Experience is needed to combine tools, and it works best with other means.
-
All the same, it has the potential to be the most valuable tool for technical market forecasting.

Conclusion
It is an all-embracing model built on human attitudes, market actions, and the dynamics of price movement. With the Elliott Wave principles in play, traders are in a good position to predict future trends, find potential high-value targets, and measure risk.
Whatever you decide to call it, Elliott Wave Theory, stock market wave theory, or simply wave theory, the fundamental basis remains the same - markets operate in waves, and to conquer market behaviour, one must learn the waves.
Check out our comprehensive guide on Dow Theory if you're curious about how traditional market movements serve as the basis for technical analysis.

DISCLAIMER: This blog is NOT any buy or sell recommendation. No investment or trading advice is given. The content is purely for educational and information purposes only. Always consult your eligible financial advisor for investment-related decisions.