
In the world of technical analysis, charting pattern analysis is useful for assessing market psychology. A high level of confidence and popularity is associated with the head and shoulders pattern, among other reversal patterns.
Search queries such as:
What is the head and shoulders pattern meaning?
How to identify the head and shoulders chart pattern?
How to trade it effortlessly?
What is a real head and shoulders pattern example?
Are answered step by step, and in accessible terminology in the subsequent segment.
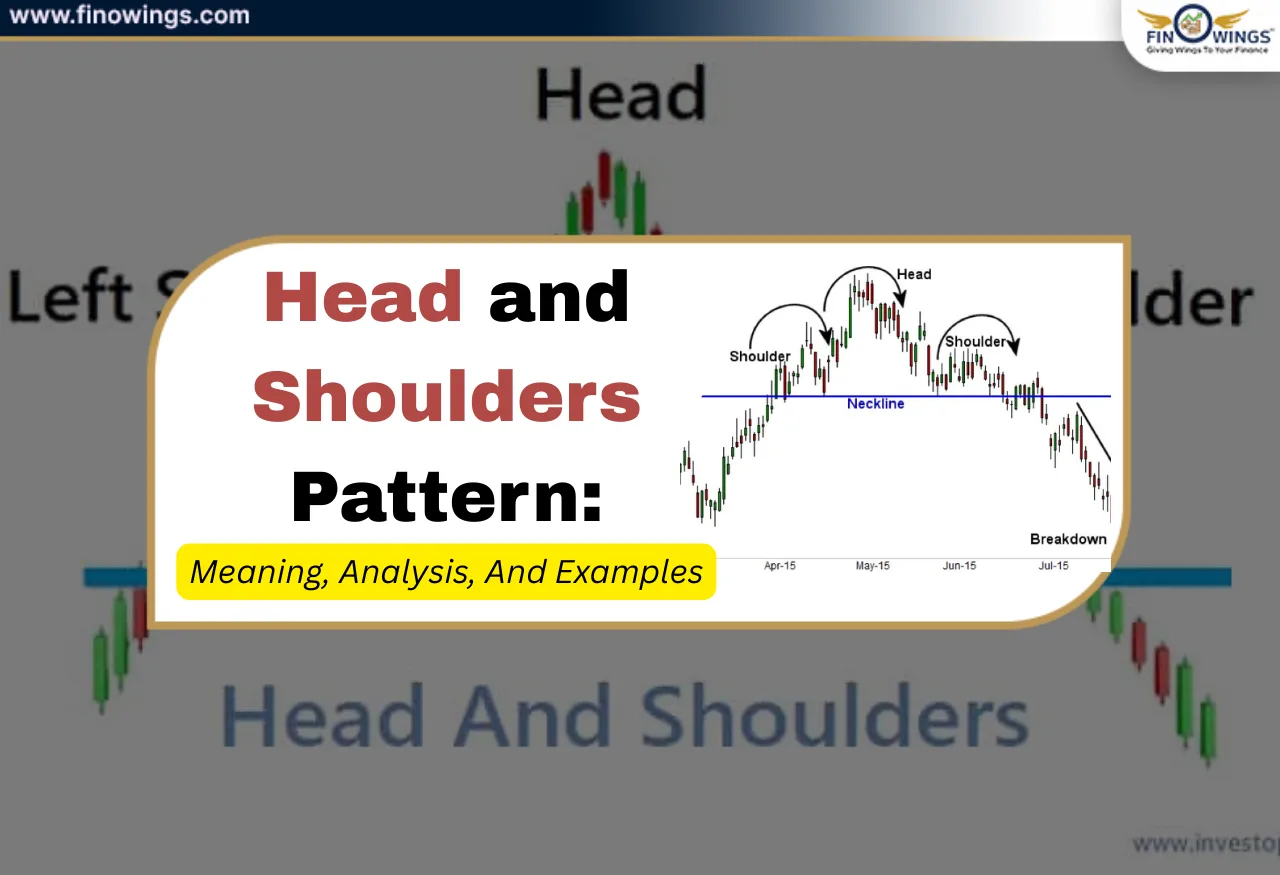
What is the Head and Shoulders Pattern?
Considered to be a trend reversal chart pattern, the Head and Shoulders Pattern notes a potential switch in direction from an uptrend to a downtrend.
It typically forms:
-
Post a significant uptrend
-
At market peaks
-
When buying momentum starts to weaken
-
It resembles a human head and two shoulders, hence the name.

Meaning of the Head and Shoulders pattern
The meaning of the 'head and shoulders' pattern refers to the change in market psychology:
-
The buyers get the market to climb (left shoulder).
-
The buyers make one final, stronger push (head).
-
The buyers become weak and fail to push (right shoulder).
-
The sellers step in and lose control of the trend.
To summarise:
The pattern demonstrates that the market buyers begin to lose control and the sellers begin to take over control of the market.

Head and Shoulders Chart Pattern Structure
The pattern consists of four major parts:
1. Left Shoulder
-
Prices begin to rise.
-
A pullback occurs.
-
Resistance is shown for the first time.
2. Head
-
Prices begin to rise and make a new high.
-
A large part consists of a strong buying opportunity.
-
Then another pullback occurs.
3. Right Shoulder.
-
Prices begin to rise again but do not make a new high.
-
The weakness in momentum is indicated.
4. Neckline.
-
The support line attaching the first two pullbacks is critical for confirmation.
-
Once the neckline is broken, the pattern is confirmed.
The Reason Head and Shoulders Patterns Work
The Head and Shoulders pattern reflects crowd psychology.
The pattern works in the following ways:
- Profit Booking: Initial buyers in the pattern start closing their positions in profit.
- Buyer Hesitation: New buyers are unwilling to enter higher in the pattern.
- Seller Spotting: Other market participants start to lose faith and become sellers.
- Stop Loss Triggers: Orders to close positions and trigger a drop in price (stop loss) are placed below the neckline.
For this reason, market participants (including other traders and algorithms) respect the Head and Shoulders pattern in a Chart.
Identifying The Types Head and Shoulders Patterns
The Head and Shoulders pattern can be identified in the following ways:
1. Classic Head and Shoulders (Bearish)
- Appears after an uptrend.
- Indicates a trend reversal toward the downside.
- This variation is the most common and most used by traders.
Usually, this is what most people mean when they refer to a Head and Shoulders pattern.
2. Inverse Head and Shoulders (also called Bullish)
- Identifies a trend reversal after a downtrend.
- The structure of the pattern is the opposite of classic.
The inverse pattern is just as strong but indicates a buying opportunity.

Predicting price movement with Head and Shoulders Pattern: Step-By-Step
Let’s practise Head and Shoulders pattern trading with this step-by-step breakdown.
Step 1: Identify the Pattern Clearly
For any trading to take place, these must be confirmed:
- There is a clear uptrend before the pattern.
- The left shoulder, head and right shoulder are well-defined.
- There is a neckline.
If the pattern isn't clear, it is advisable to leave it instead of forcing it.
Step 2: Draw the Neckline
To form the neckline, the two swing lows should be connected. A neckline can look flat, sloped upwards, or sloped downwards; however, the more horizontal the neckline is, the stronger it is as a signal. The neckline is the most important level of support or resistance of this pattern.
Step 3: Wait for Neckline Break
Do not make a trade without a confirmation. A confirmation occurs when the price closes below the neckline of the pattern and preferably with higher volume, as this can provide a more reliable level, helping to avoid false signals.
Step 4: Entry Strategy
Aggressive Entry: Enter the trade immediately after the neckline is broken.
Conservative Entry: Wait for a pullback, also known as a retest, to the neckline and enter the trade when there is rejection of the neckline. Especially for beginners, it is better to wait for a conservative entry.
Step 5: Stop Loss Placement
Even with a conservative entry, it is important to have proper risk management and clear levels. Common places for stop loss include above the right shoulder and above the neckline retest high, but it is important not to set tight stops without any supporting structure.
Step 6: Target Calculation
Targets for this method are calculated by head height minus neckline for the target distance, then projecting the same distance below the neckline to form a reasonable price target for this method.
Example of Head and Shoulders Pattern
A practical head and shoulders pattern example includes:
The stock is increasing in value from ₹100 to ₹180.
The shoulder on the left is ₹160.
Head is (the highest point) ₹180.
The shoulder on the right is ₹165.
Neckline is at ₹150.
After the price drops below ₹150:
A sell signal is triggered
Target expected is ₹180 - ₹150 = ₹30
Target should be at ₹120

This example shows how some traders utilise the pattern.
Head and Shoulders Pattern Best Timeframes
The pattern is effective across all timeframes is more effective the longer the timeframe is.
-
Daily charts (Best overall).
-
1-hour and 4-hour charts (swing trading).
-
Weekly charts (Best option to see long-term trend changes).
The lower the timeframe is the more false signals there will be.
Head and Shoulders Pattern Volume Analysis
So volume does play a bit of a supporting role:
-
Volume is large in value but is on the left shoulder and head.
-
The volume on the right shoulder is a little.
-
Volume increases when the neckline is broken.
-
Volume tells how strong the reversal is going to be.
Head and Shoulders Pattern vs Double Top
|
Feature |
Head & Shoulders |
Double Top |
|
Structure |
3 peaks |
2 peaks |
|
Reliability |
Higher |
Moderate |
|
Psychology |
Gradual weakness |
Sudden rejection |
|
Use case |
Trend reversal |
Resistance break failure |
Both patterns signal a downtrend; however, the head and shoulders pattern offers far better risk-to-reward potential.
What Are The Common Mistakes Likely To Be Made
Below are a few mistakes worth avoiding:
-
Trading before the neckline is broken
-
Not factoring in volume
-
Pattern forcing
-
Using tight stop-loss orders
-
Trading within a ranging market
-
Discipline will come before the recognition of the patterns.
What Are The Best Indicators To Use Alongside Head And Shoulders
More accurate predictions can come as a result of combining patterns with:
-
RSI (divergence)
-
MACD (momentum change)
-
Volumetric indicators
-
Support and resistance areas.
Having confirmation from patterns and indicators will enhance the odds of a successful outcome.
Is the Head and Shoulders Pattern 100% Accurate?
100% accuracy with no pattern will ever exist.
Limitations are as follows:
-
Fake breakouts
-
Volatility from unpredictable news
-
Stocks with less activity
-
Sideways movements in the market
-
For these reasons, risk management is paramount.
Is the Head and Shoulders Suitable for Beginners?
Yes, because identifying the patterns is very simple and should come very easily to any newly minted trader. There is also a clear market structure which is very easy to discern. This means defined entry, stop, and target which is ideal for beginners. Some explanations for the entry and exit points. This pattern also allows beginners to learn about market psychology.
This is a skill that beginners should work on by practising on historical charts first.
Inverse Head and Shoulders: Brief Overview
Inverse head and shoulders pattern:
- Shows bullish continuation.
- This pattern formation is a clear sign the overall market is reversing.
- You confirm the potential of the pattern by breaking a neckline, which allows for great positioning for any potential trader.
The trading rules for this pattern are the exact opposite of the bearish formation.
Real-World Markets Where It Works Best
This head and shoulder chart pattern works best:
- In Stocks
- Indices (NIFTY, BANKNIFTY)
- In the Forex market
- In the Crypto markets
The potential for a reliable trade increases with liquidity.
Head and Shoulders Pattern Explained In One Line
The head and shoulders pattern shows buyers losing control and sellers taking over, marking the point of a potential trend.
Is Head and Shoulders Pattern Reliable?
Yes, as long as it is done in the right manner. The explanations for the patterns go a long way and the deeper meaning is much more than synchronized pockets of head and shoulders patterns. It is a clear explanation of the supply-demand changes that allow for it to be a reliable explanation of a market when respected. The traders who can use this pattern the most effectively are the ones who use confirmation, are risk-averse, and make the best trades free of any emotional influence.
Key Takeaway
This pattern does not tell you what the market is going to do, but it does show what the market is already doing. Make sure to listen to it, trade setup with discipline and control your risk.

Conclusion
One of the best technical analysis tools available to you is the head and shoulders chart pattern, and it can be a great reversal tool. This guide on head and shoulders pattern trading allows traders to recognise when a trend is exhausted, make informed entries into a trade, and implement risk control. With time and effort, the head and shoulders pattern example can become a useful part of any trading style.

DISCLAIMER: This blog is NOT any buy or sell recommendation. No investment or trading advice is given. The content is purely for educational and information purposes only. Always consult your eligible financial advisor for investment-related decisions.


