
Tracking investor sentiment is now as important as tracking earnings, GDP growth, and interest rates. Investors are using more rapid and emotional tools, such as the Market Mood Index, to untangle the fear and greed driving decision-making.
As we move into 2026, there is a question:
Are the markets rational or are the emotions running the show?
In this guide, we will analyse the Market Mood Index 2026 and its sign, its approximation to stock market psychology, and how intelligent investors can use market sentiment indicators to make more rational decisions.
What Is the Market Mood Index?
Market Mood Index refers to tools that gauge investor sentiment in the financial market. These tools do not track figures such as sales and profits. Rather, they measure the market's psychology, whether it is optimistic, pessimistic, fearful or greedy.
In essence:
The Market Mood Index gauges how investors feel, not what they do.
These emotions impact:
- Buying and selling.
- Volatility of the markets.
- Bubbles and crashes.
Why Is Investor Sentiment So Important In 2026?
2026 markets look like this:
- More retail participation.
- AI and Algorithms are driving the markets.
- Geopolitical issues.
- Information spreads quickly via social media.
In this scenario, emotions shape the trends. If greed takes the front seat, the markets objectively go too high. If fear takes over, the price is too low compared to fundamentals.
That is why tracking market sentiment is no longer a nice-to-have, but a must.
Main Aspects of the Market Mood Index
The Market Mood Index is not one single number, but a combination of multiple sentiment indicators.
1. The Fear and Greed Index
The most famous sentiment metric is the fear and greed indexmost people track, such as CNN. The index takes the following into account:
- Market momentum.
- Volatility (VIX).
- Demand for safe-haven securities.
- Breadth of the market.
- The put-call ratio.
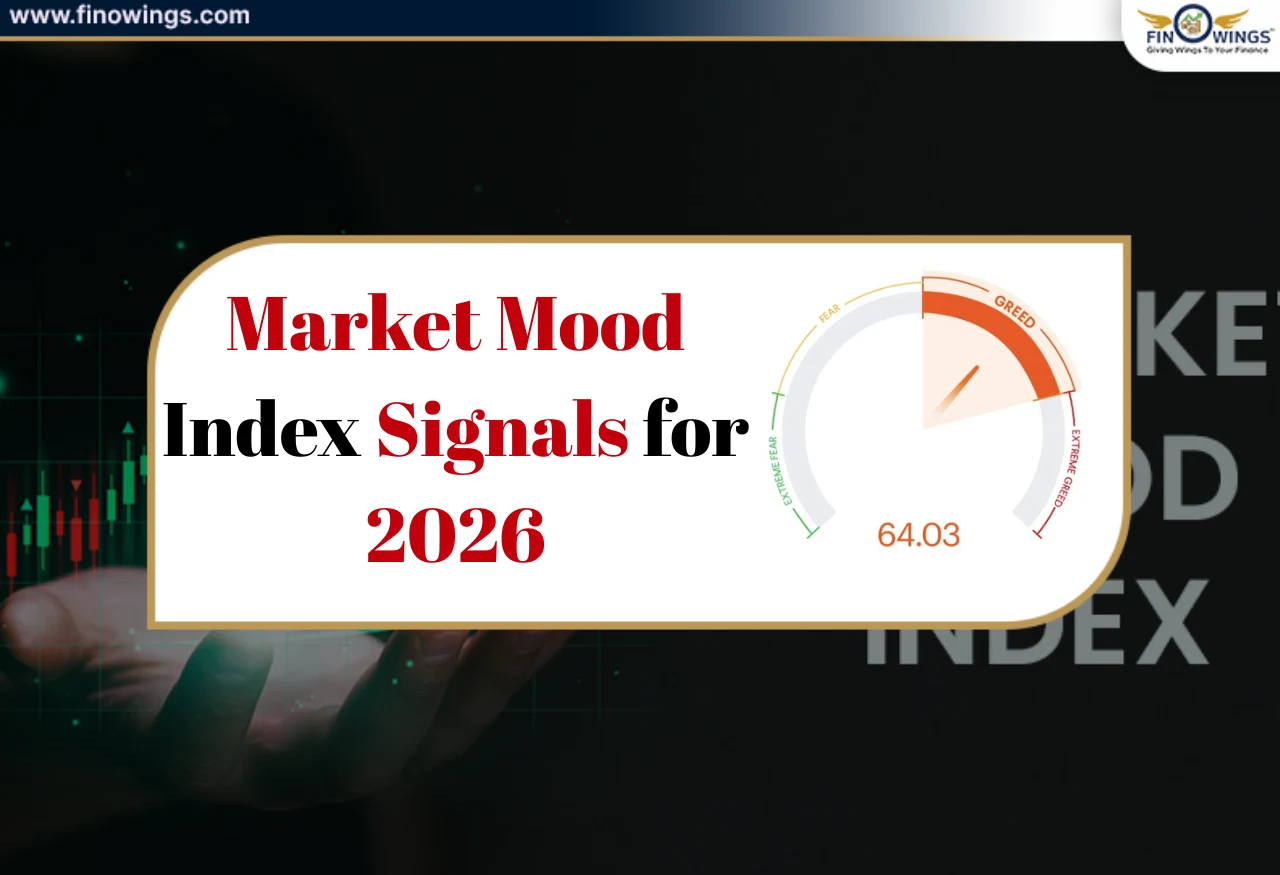
Scale:
0-25 = Extreme Fear
26-45 = Fear
46-55 = Balanced
56-75 = Greed
76-100 = Extreme Greed
2. Volatility Index (VIX)
The VIX is the index for predicted volatility.
Rising VIX = Fear
Falling VIX = Greed or complacency
In 2026, spikes in VIX are closely monitored as signs of potential panic selling.
3. Put–Call Ratio
This indicates whether investors are purchasing more puts (fear)or calls (greed).
High ratio → Sentiment becomes more bearish.
Low ratio → Sentiment becomes more bullish.
4. Market Breadth Indicators
These assess how many stocks are involved in a rally.
Narrow participation → Fragile optimism
Broad participation → Healthy optimism
Market Mood Index 2026: What Are the Signals Saying?
What is the Market Mood Index 2026 telling us so far?
Current Market Sentiment Trends
In early 2026, market sentiment shows mixed signals across the globe:
- Retail investors are optimistic.
- Institutional investors are more cautious.
- Volatility is still elevated.
- Valuations in some sectors appear stretched.
This indicates a late-cycle emotional phase, with the presence of both greed and fear.
Are Investors Motivated By Greed in 2026?
Evidence of Greed and Market Overconfidence
Here is how we detect greed in the market:
- Market participants are buying the same momentum stocks.
- There is a lack of concern for risk.
- Market valuations are not aligned with realistic metrics.
The signs of greed in 2026 are:
- Excessive thematic trade positioning.
- Reckless use of derivatives.
- Increased IPO activity.
The above signs demonstrate market confidence bordering on overconfidence– a clear signal of greed.
Is There Fear Just Below the Surface?
Although the market shows signs of confidence, fear is still there.
Evidence of Fear and Market Undercurrents
- Unjustified extreme market corrections.
- Excessive use for hedging.
- Investment in defensive equity sectors.
Although the market is characterised by significant risk-taking, it is helping to conceal the underlying fear of market participants.
Why Do Emotions Dictate Stock Prices?
The market moves on human behaviour.
Market Cycle of Emotions
1. Optimism
2. Enthusiasm
3. Thrill
4. Euphoria(Extreme Greed)
5. Anxiety
6. Denial
7. Panic
8. Capitulation(Extreme Fear)
9. Despair
10. Recovery
The Market Mood Index shows where the market lies in the above cycle.
Current indicators suggest that the market in 2026 is between excitement and anxiety – a precarious emotional state.

How Smart Investors Use Market Sentiment Indicators
Professional investors don’t follow sentiment - they use it as a contrarian tool.
Practical Uses of Market Sentiment Indicators
Extreme greed → reduce risk, profit
Extreme fear → look for value plays
neutral sentiment → focus on fundamentals
Smart investors combine:
- Market Mood Indicators
- Valuation metrics
- Risk management
Market Mood Indicators vs. Fundamentals
- Short term, sentiment wins.
- Long term, fundamentals always win.
That’s why 2026 investors need to balance:
- Emotional indicators (fear and greed index).
- Financial indicators (earnings, cash flow).
- Ignoring either one can lead to mistakes.
Common Mistakes Investors Make Using Sentiment Data
1. timing tool sentiment alone.
2. Extreme readings are ignored.
3. Emotional crowd follow.
4. They sentiment over daily mood swings.
The Market Mood Index works best as a context tool and not as a prediction tool.
Market Mood Index 2026: Summary
- Investor sentiment in 2026 is mixed.
- Market greed is noticeable in some areas.
- Market fears still stem from uncertainty.
- Market sentiment measures can provide advanced signals.
- Stock market psychology deepens in importance in volatile periods.

Conclusion
Emotional volatility is high in the Market Mood Index 2026, due to the fact that pure greed and pure fear are not driving the market. Investors who are able to identify and act upon market sentiment indicators, leverage stock market psychology, and refrain from making emotionally driven decisions are positioned to perform better.

DISCLAIMER: This blog is NOT any buy or sell recommendation. No investment or trading advice is given. The content is purely for educational and information purposes only. Always consult your eligible financial advisor for investment-related decisions.


