
When it comes to trades, deals, and investments, conducting a technical analysis is key to success. Most traders utilise candlestick charts, but a less conventional, equally useful, and equally valuable charting technique is to focus solely on price points and utilise Renko charts to ditch the market noise.
This guide will discuss Renko charts, Renko charts technical analysis, Renko trading strategy, Renko indicators, and a direct but thorough Renko vs candlestick comparison in a manner that is straightforward and accessible.
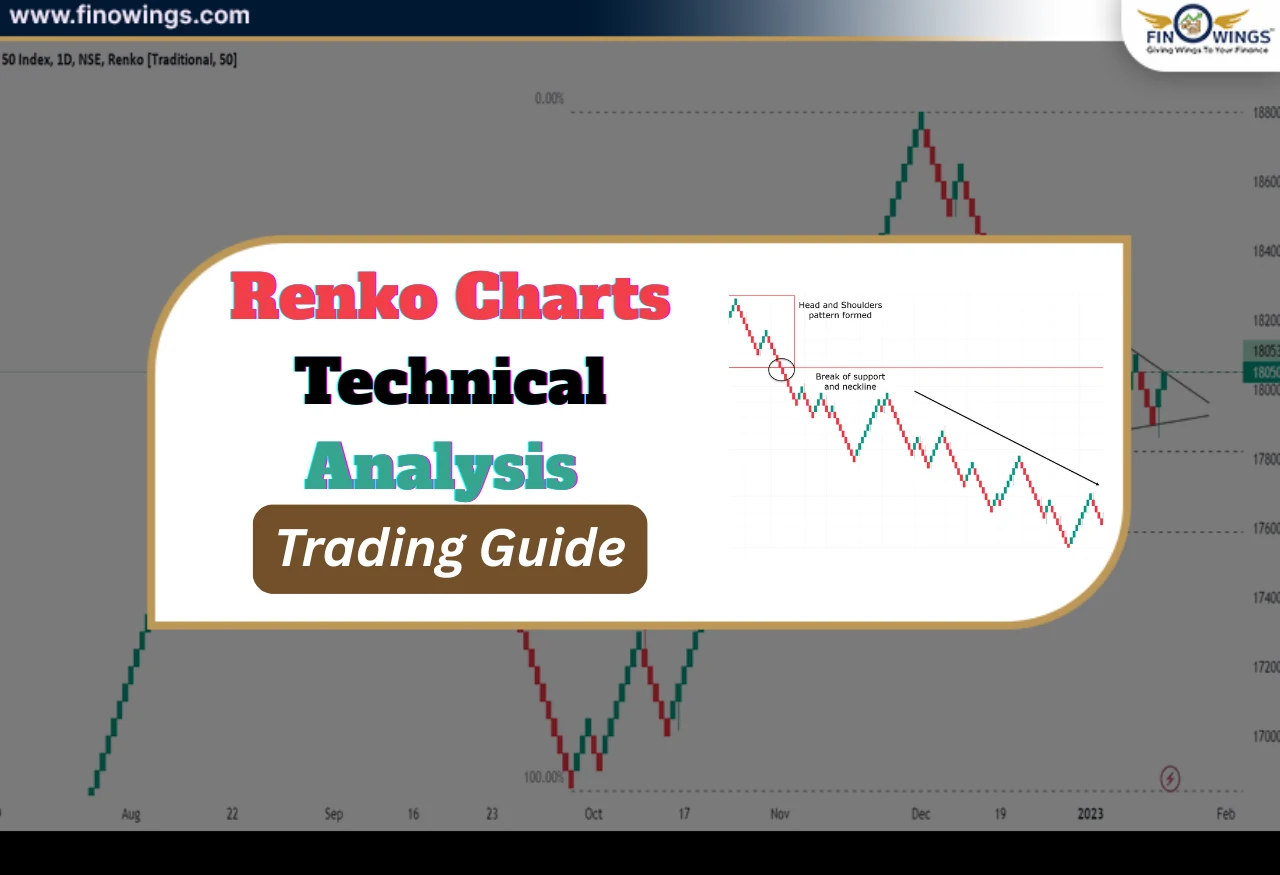
What Are Renko Charts?
Renko charts are a form of price charts that centre only on price movement, ignoring the component of time. In Renko charts, there are bricks instead of candles and bars. As a note, the Japanese word renko means brick. Each of the bricks equates to a single, fixed price movement instead of a fixed time period that is fixed.


Key Rule of Renko Charts
-
A new brick will only form at a price that moves by a certain amount.
-
It is a time-independent process.
-
Minor price fluctuations are filtered, and a time-independent process.
That is why Renko charts are useful for beginners- they filter out the noise and make the charts easier to read and understand.

How Renko Charts Work
Let’s understand with an example:
-
Brick size is set to 10 points.
-
The price increases from 100 to 110 → This creates a bullish brick.
-
Price increases from 110 to 120 → Another brick is created.
-
Price decreases from 120 to 110 → This creates a bearish brick.
-
No bricks are created if the price only moves 3–4 points.
What Does This Mean
-
We tend to ignore any minor price movements.
-
Only meaningful price movements are recorded.
-
Trends become very easy to identify.
Why Traders Use Renko Charts
The main purpose of Renko charts is to identify trends easily.
Benefits of Renko Charts
-
It eliminates the noise of the market.
-
Clearly shows the direction of the trend.
-
Makes identifying support levels and resistance easier.
-
Helps reduce frustration and over-trading.
Due to these benefits, Renko charts are very popular and are used by traders for trend-based trading.
Renko Charts for Beginners: Pros and Cons
Pros
-
Structure is very clean.
-
Price action is easy to read.
-
Fewer false signals.
-
Good for following trends.
Cons
-
You cannot perform time-based analysis.
-
Sudden volatility due to news may appear to be missing.
-
Entries may be delayed due to incorrect brick size.
This is why the correct brick size is the most important criterion for beginners.
Renko Vs Candlestick Charts
Renko Vs Candlesticks is most likely the most common question for traders.
Renko Vs Candlestick Comparison Table
|
Feature |
Renko Charts |
Candlestick Charts |
|
Time factor |
Ignored |
Very important |
|
Market noise |
Very low |
High |
|
Trend clarity |
High |
Medium |
|
Signal speed |
Slightly delayed |
Faster |
|
Best suited for |
Trend trading |
Intraday & scalping |
This is why your trading style will dictate the Renko Vs Candlestickpillar.
What is the Best Brick Size for Renko Charts
The best brick size is the most important setting in Renko charts.
How to Choose Brick Size
Fixed values– This keeps the brick size the same for 10, 20, 50 points, etc.
ATR brick size– This is the best option, as it adjusts the size based on the volatility and helps present better market signals.
Best Indicators to Use with Renko
Using Renko charts with the right indicators can enhance its capabilities.
Popular Indicators for Renko Trading
1. Moving Averages (EMA/SMA) – Serves as trend confirmation
2. RSI (Relative Strength Index) – Determines overbought and oversold zones.
3. MACD – Ascertains the momentum and direction of the trend.
4. ATR (Average True Range) – Good for determining the best size of your bricks.
Note: Don’t apply excessive indicators as they can subtract from the focus of your charts.
Renko Trading Strategy
Let's examine a practical example of the renko trading strategy now.
Trend Following Renko Strategy
First things first:
Step 1: Apply the Renko Chart and set the brick size using the ATR method.
Step 2: Add a 20-period EMA.
Step 3: For the Buy Setup, ensure the price is above the 20 EMA. Then, look for 3 or more consecutive green or bullish bricks, and ensure the RSI indicator is above 50.
Step 4: For the Sell Setup, ensure the price is below the 20 EMA. Look for 3 or more consecutive red or bearish bricks, and ensure the RSI is below 50.
Step 5: For the Stop Loss, place a stop loss at the last opposite brick.
Step 6: For the Target, aim to maintain a minimum Risk to Reward ratio of 1:2.
That’s a basic but effective example of the technical analysis of Renko charts.

Best Markets for Renko Trading
Renko works across all markets, but the conditions are best when the market is performing a strong trend. Here are the best-performing ranges for Renko:
1. Stocks: especially strong trending stocks
2. FX
3. Commodities
4. Indices like Nifty and Bank Nifty
In markets that are highly choppy, Renko's may perform poorly.
Common Mistakes in Renko Trading
Luckily, beginner traders in the Renko market often make the same mistakes. Here are a list of Renko mistakes:
1. Using brick sizes that are too small.
2. Trading every single brick that appears.
3. Overloading charts with unnecessary indicators.
4. Applying time logic in a market.
Remember, Renko charts require a bit of extra patience and a bit of extra discipline.
Who Should Use Renko Charts?
Renko charts work best for these types of traders:
-
Those who focus on trend-based trading.
-
Those who wish to mitigate emotional decision-making.
-
Those who appreciate simplified and minimalistic charts.
-
Traditional candlestick charts may work better for traders focusing on scalping or news-based trading.

Conclusion
Renko charts allow you to see technical analysis of price movements clearly and concisely. With an adequate brick size and a disciplined Renko trading method, traders can successfully obtain strong trends. These charts help beginners in particular to develop patience, mental clarity and disciplined trading, making them a fantastic tool for trading.

DISCLAIMER: This blog is NOT any buy or sell recommendation. No investment or trading advice is given. The content is purely for educational and information purposes only. Always consult your eligible financial advisor for investment-related decisions.


