
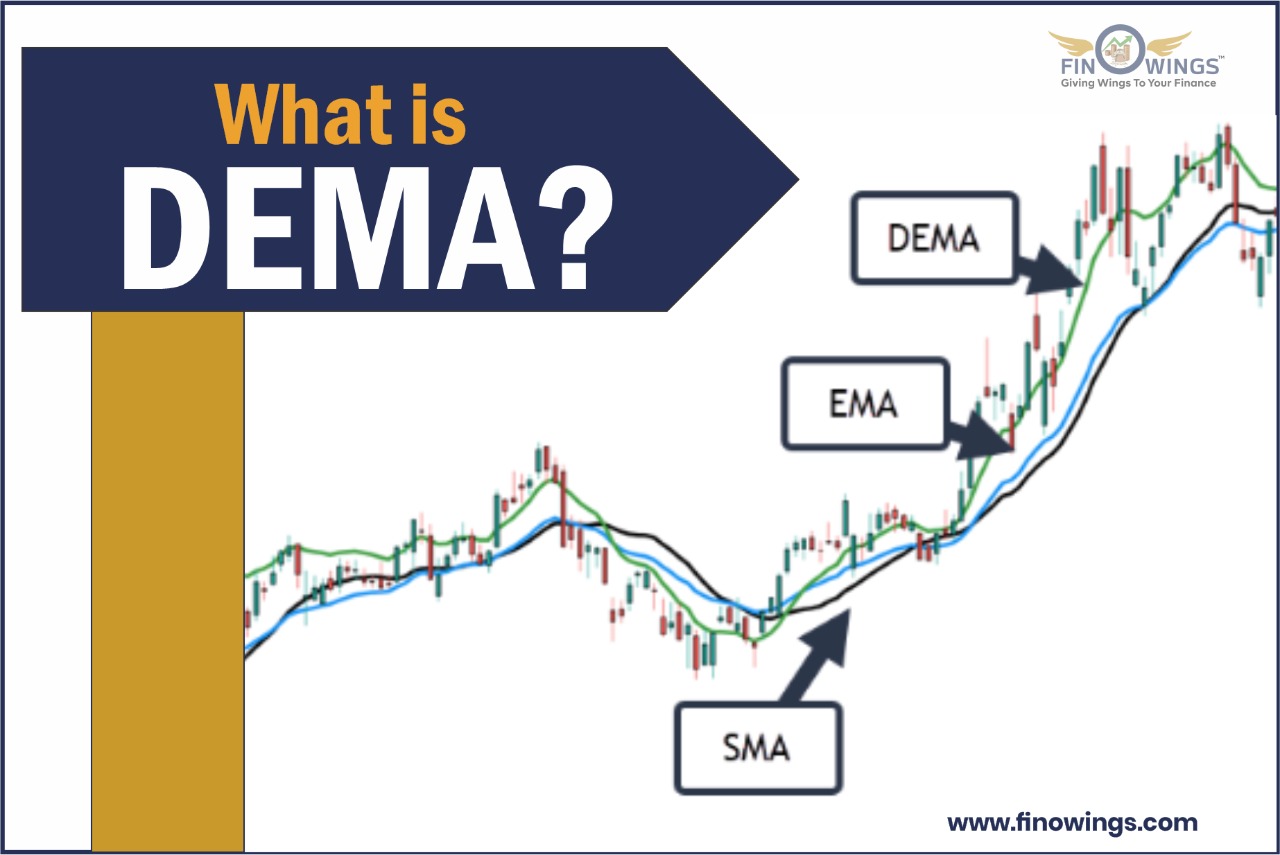
1. What is DEMA?
The DEMA stands for Double Exponential Moving Average. It is an indicator designed to reduce the lag in the results generated by the moving average. It helps traders in analyzing trend reversals quickly.
Technical traders use DEMA to decrease "noise" that can disturb the movements on the price chart.
Like other moving averages, DEMA is also used to indicate the trends in the cost of assets or stock. The DEMA tracking helps traders to analyze the uptrend and downtrend of the stocks.
Uptrend: When the price gets higher than its average price.
Downtrend: When the price gets lower than its average price.
The double in Double exponential moving average means two EMAs. The DEMA uses two EMAs to reduce lag in the price charts.
Patrick Mulloy introduced the moving average variation in a 1994 article titled "Smoothing Data with Faster Moving Averages."
2. The formula for DEMA
DEMA is a combination of smoothed EMA and a basic EMA. This combination reduces the lag in the DEMA.
How to calculate Double Exponential Moving Average?
The DEMA can be calculated as
DEMA = [2 x EMA(n)] - [EMA(n) (EMA(n0)]
where,
n = look-back period
DEMA's name depicts that it uses an EMA of the EMA, not 2*EMA.
Similarly, there is another known measure, triple EMA, which uses the EMA of the EMA of the EMA.
3. Example-
Let us look at the price variations of Apple Inc. over nine months, from Apr 2020 to November 2020. The chart includes candlesticks, which reflect Apple Inc.'s stock price variation for each interval.
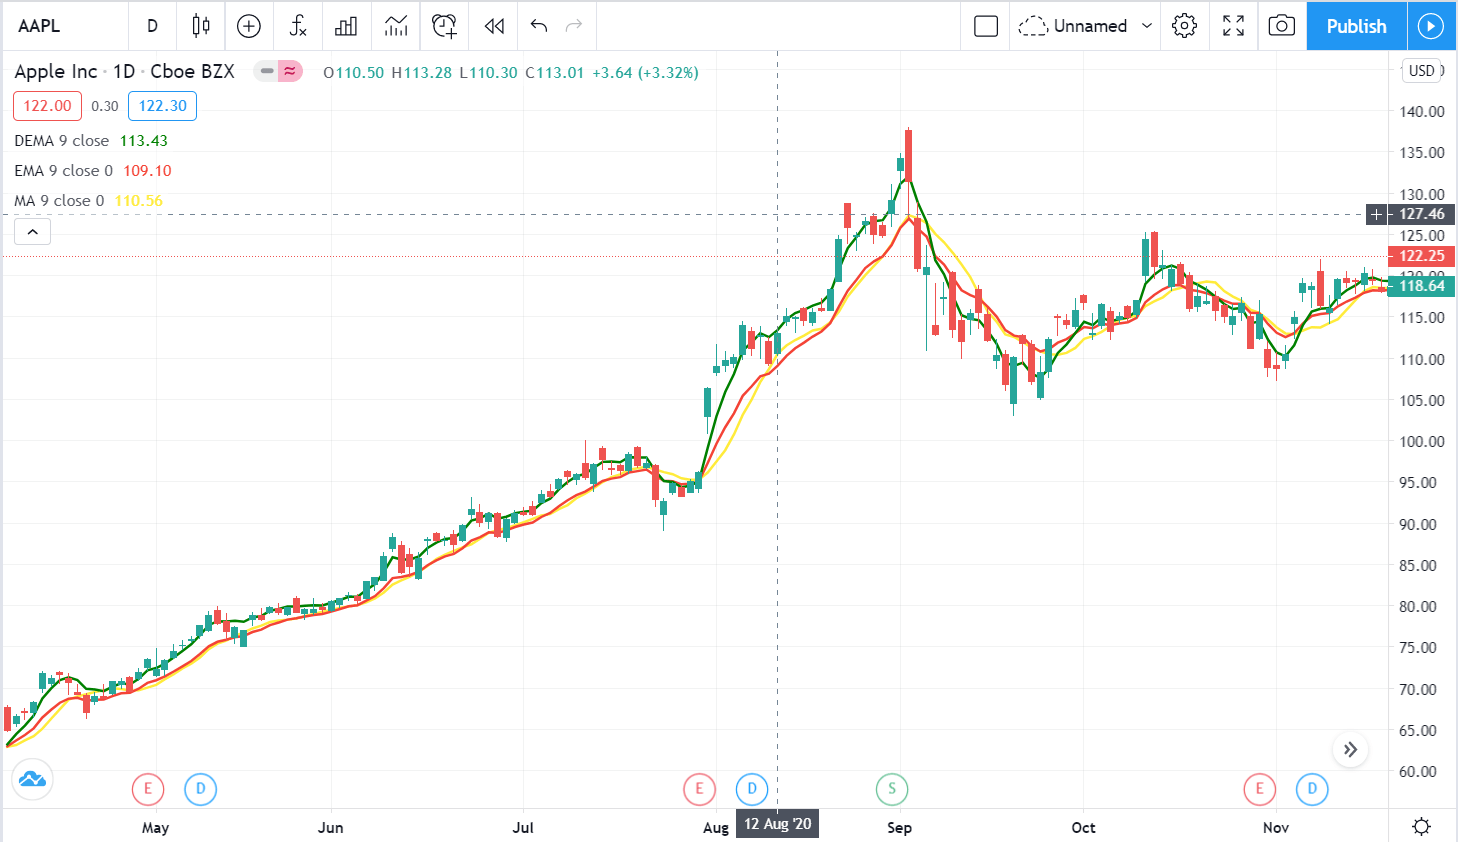
Source: Trading View
The red line presents the Exponential Moving Average (EMA), the yellow line represents the Simple Moving Average (SMA) line, and the green line depicts the DEMA.
We notice that DEMA is near the price points, with little deviations.

Since the DEMA line shows stock prices closely, it is the most exposed to stock volatility. A shift in volatility is a good indicator of a trend reversal and stock transactions. Let us examine the discrepancies when the number of days for the DEMA is changed:
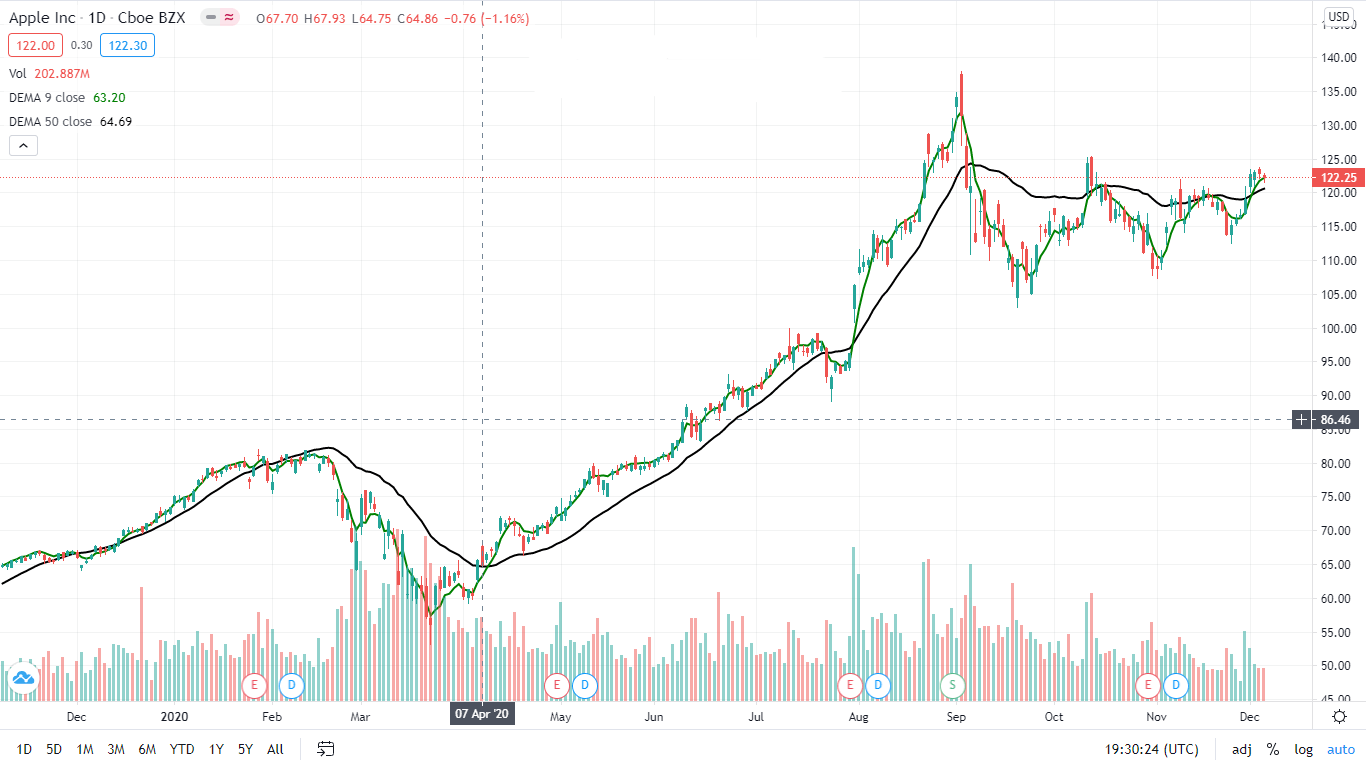
Source: Trading View
The black line shows the 50-day DEMA, separated from the stock prices, compared to the green line, which represents the 9-day DEMA.
The moving averages are dependent on the final data point. The lower the number of days of the moving average, the outcome of the last data point will be high.
It is visible here that the lower the number of days used in computing the moving average, the higher the volatility of that moving average. Therefore, DEMA will be more volatile over a few days and comprise price shifts more accurately.
4. Interpretation of DEMA
It is straightforward to interpret DEMA. When the stock price gets higher than the DEMA and keeps increasing, it shows an uptrend.
When the stock price is below the DEMA, and the DEMA keeps dropping, it shows a downtrend.
As noticed above, only some traders represent two or more DEMAs with distinct lookback periods on a single chart. When these lines intersect, trade signals are induced.
For instance, a trader may consider buying if a 50-period DEMA strikes above a 100-period DEMA or selling when the 50-period crosses back below the 100-period.
It can be less trustworthy in predicting potential support and resistance price pinpoints. To specify possible support or resistance matters, a trader considering a DEMA should ensure that it has performed this function in the past. If not, it probably will not in the future.
This precise moving average indicator is more conditional on the final data point.
It is noticeable in the above example. The previous heading showed that the lower the number of days used in computing the moving average, the higher the volatility of that moving average.
5. Who uses DEMA and Why?
DEMAs respond faster than conventional moving averages, so their users are likely to be swing traders. On the other hand, long-term investors, who exchange less often, may, more often than not, find a conventional moving average adequate for them.
These are mainly used to point out an upward or downward price direction and analyze its stability. Traders tend to see if the price will drive above or below the DEMA. Some traders use numerous DEMAs with diverse lookback periods, monitoring for them to strike each other.
A DEMA can display price support or resistance like any other moving average. It can assist in determining a price point at which a trend will switch or even halt.
The equation does not depend on a dual exponential smoothing element. Instead, the equation doubles the EMA but revokes the lag by deducting a smoothed EMA.
Because of the intricacy of this equation, DEMA calculations need more data than exponential moving average (EMA) calculations. Spreadsheets and technical charting software can assist in easing calculations.
5.1. Trend Analysis:
Trend study directs to the use of the price trend of a historical asset to envision future movement. The direction signaled by the DEMA is how the asset costs are predicted to move. A rising DEMA symbolizes a possible rising price, whereas a decreasing DEMA symbolizes a potential price drop.
The price point of an asset above the DEMA is likely to rise. Similarly, the price point below the DEMA is likely to fall. A falling price trend may reverse if the asset price moves above the DEMA.
Similarly, if the asset price drops below the DEMA, the price climb is expected to invert, meaning prices may start to fall. Traders use these alerts to go long or short of acquiring profits using directional trading schemes.
5.2. Support and Resistance:
Another use of DEMA is to offer support and resistance levels for stock prices. A resistance level displays where the stock prices show inactivity to go higher, whereas support levels point where stock prices are not probable to fall below.

Source: Trading View
The charts from TradingView show a 25-day DEMA line for Apple Inc. stock (AAPL) over roughly four months.
The first half exhibits that the candlesticks serve as resistance. However, once Apple's stock price progresses above the line about March 24th, the price does not drop below the DEMA line and now acts as the support.
A breakout is a transition of support and resistance where the stock prices drive above the resistance. A breakout is a critical trend setback indicator regularly used by traders.
6. Difference Between Different Moving Averages
The simple moving average is the straightforward average of the past n-day asset prices.
The exponential moving average supplies more weight on the more current observance. The DEMA produces an even greater weight on the most current observances.
In summary, moving averages work as a technical indicator. The greater the weight on the most current observation, the greater the moving average is liable to price changes. Therefore, DEMA is the choice of short-term traders, and long-term investors prefer simple moving averages.
6.1. Most Accurate Moving Average
The precision of a moving average relies greatly on the span of the tracking period. The most typically used moving average periods are 50-day, 100-day, and 200-day moving averages. Historically, the longer the term, the more precise the indicator. It is because the effect of market day-to-day "noise" lessens over time—and it takes a stretch for a trend to clarify.
6.2. What Is MACD DEMA?
The moving average convergence/divergence (MACD) is an indicator that strives to add greater insight to the moving average by deciding the relative momentum of the price direction. The MACD is computed by deducting the 26-period EMA from the 12-period EMA. The outcome may help a trader determine whether a price trend seems to be gaining or losing strength. Some traders use MACD in combination with the DEMA instead of a traditional moving average.
7. Limitations
Moving averages can deliver little insight when the asset price is jerky or range-bound. A dependable trend cannot be recognized at such moments. The price will repeatedly go back and forth across the DEMA.
In addition, its power is the ability to diminish lag, which can also be its drawback in some circumstances.
The diminished lag gets the trader out faster, thus, lowering losses. Nevertheless, reduced lag can boost overtrading by providing way too many cues.
The indicator may notify the trader to sell when a minor stir in price is observed, therefore missing out on a better chance if the trend persists.
Its best use is with other forms of analysis, such as fundamental and price action studies. Commonly, the longer the span, the more precise the indicator will be.


