Loading...

Home >> Blog >> When Will Nifty Recover? Nifty Up or Down | 5 Reasons to Know

When Will Nifty Recover? Nifty Up or Down | 5 Reasons to Know


Once upon a time in the world of finance, there was a stock market index called Nifty. Nifty was like a rollercoaster, going up and down, and traders were always curious about where it would go next. They wondered, "When will Nifty hit the lowest point? When will it start going up again?"


To understand Nifty's journey, they looked at five important clues:


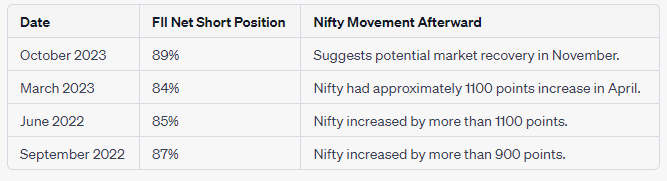
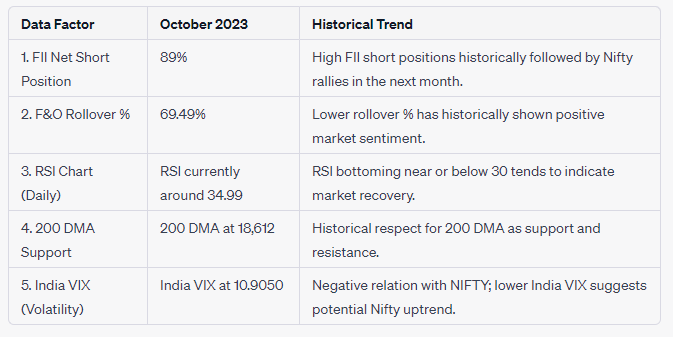
1. FII Short Positions:

   - Foreign Institutional Investors (FII) sometimes made bets against Nifty. In October 2023, they were making negative bets at 89%. Whenever they did this, history showed that Nifty usually went up the next month. For instance, in March, they had negative bets at 84%, and Nifty had a good run in April.


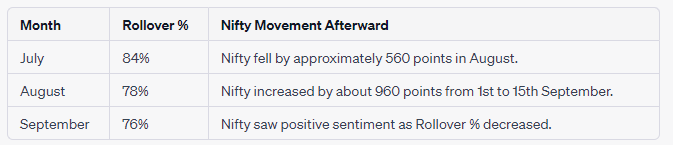
2. F&O Rollover Data:

   - Traders played a game with contracts, and they wanted to know if others were keeping their negative bets from one month to the next. If many people kept their negative bets, it might not be good for Nifty. But if fewer people did, it could be good news.


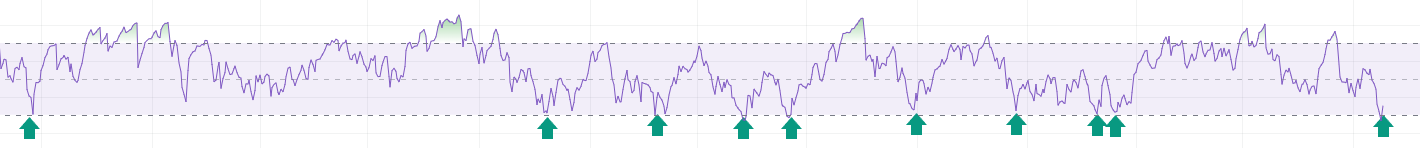
 3. Technical Chart Analysis - RSI:

   - Nifty had an indicator called the Relative Strength Index (RSI). When RSI went from being very low to a bit higher, it often meant Nifty was getting stronger. Right now, Nifty's RSI was around 34.99, suggesting that it might be on the road to recovery.


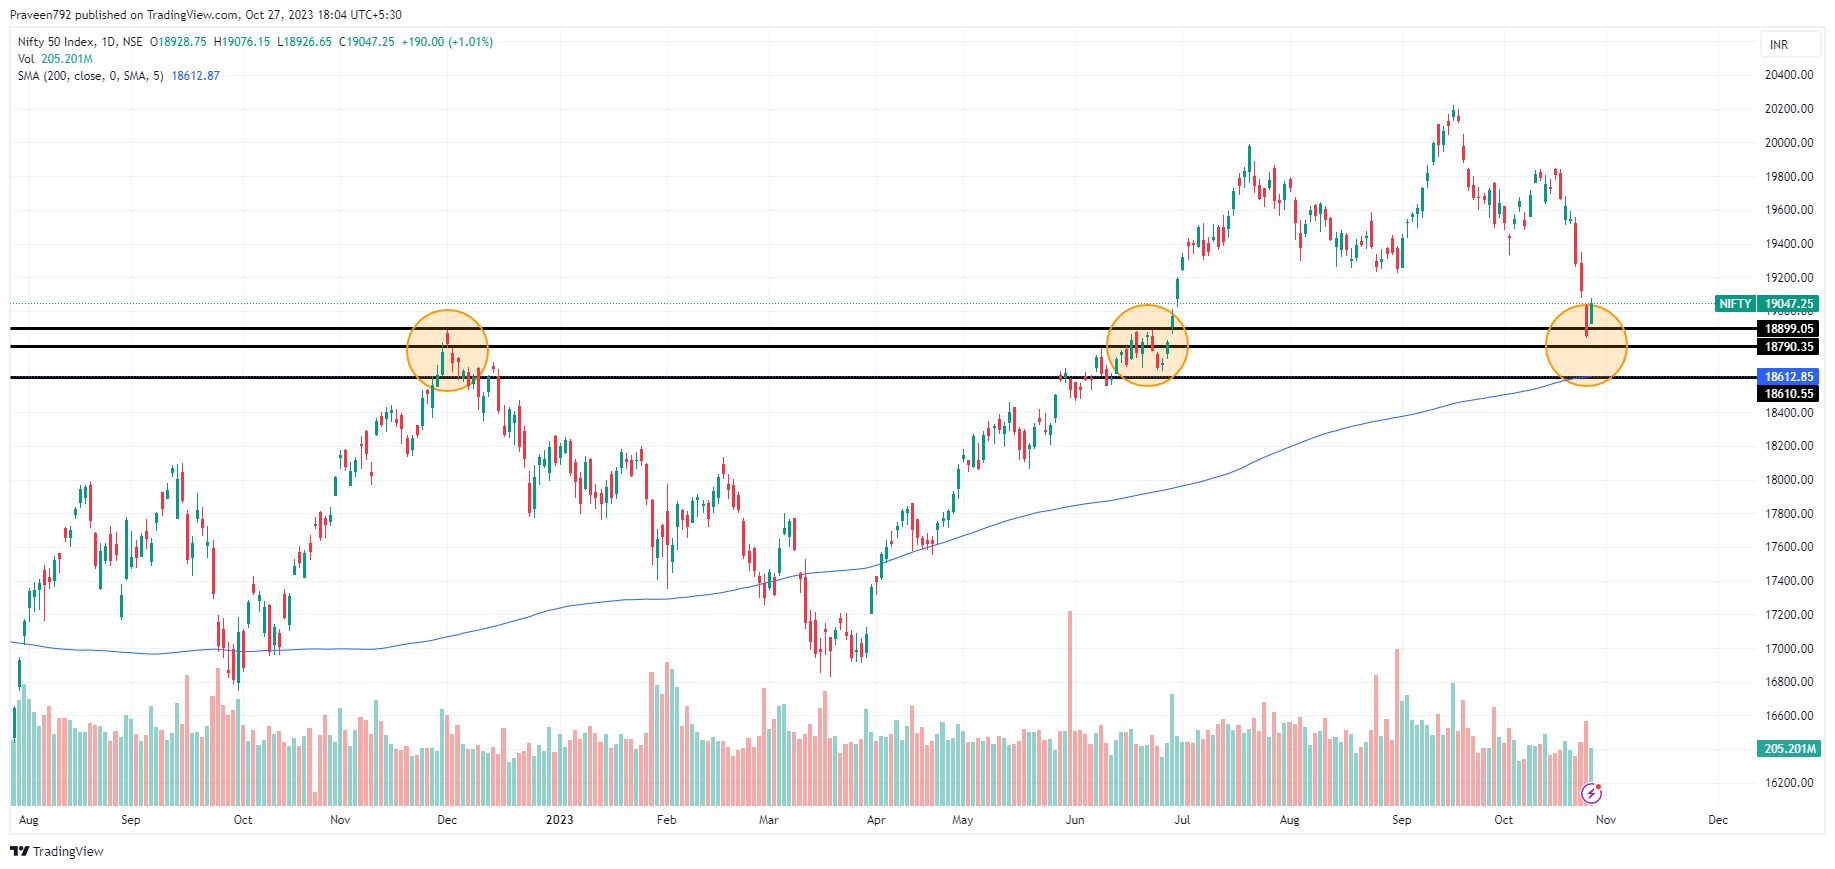
4. Technical Chart Analysis - 200 DMA:

   - Nifty also had a line on its chart known as the 200-day Moving Average (DMA). If Nifty stayed above this line, it was usually a good sign. Currently, the 200 DMA was at 18,612, a level that traders watched closely for support.


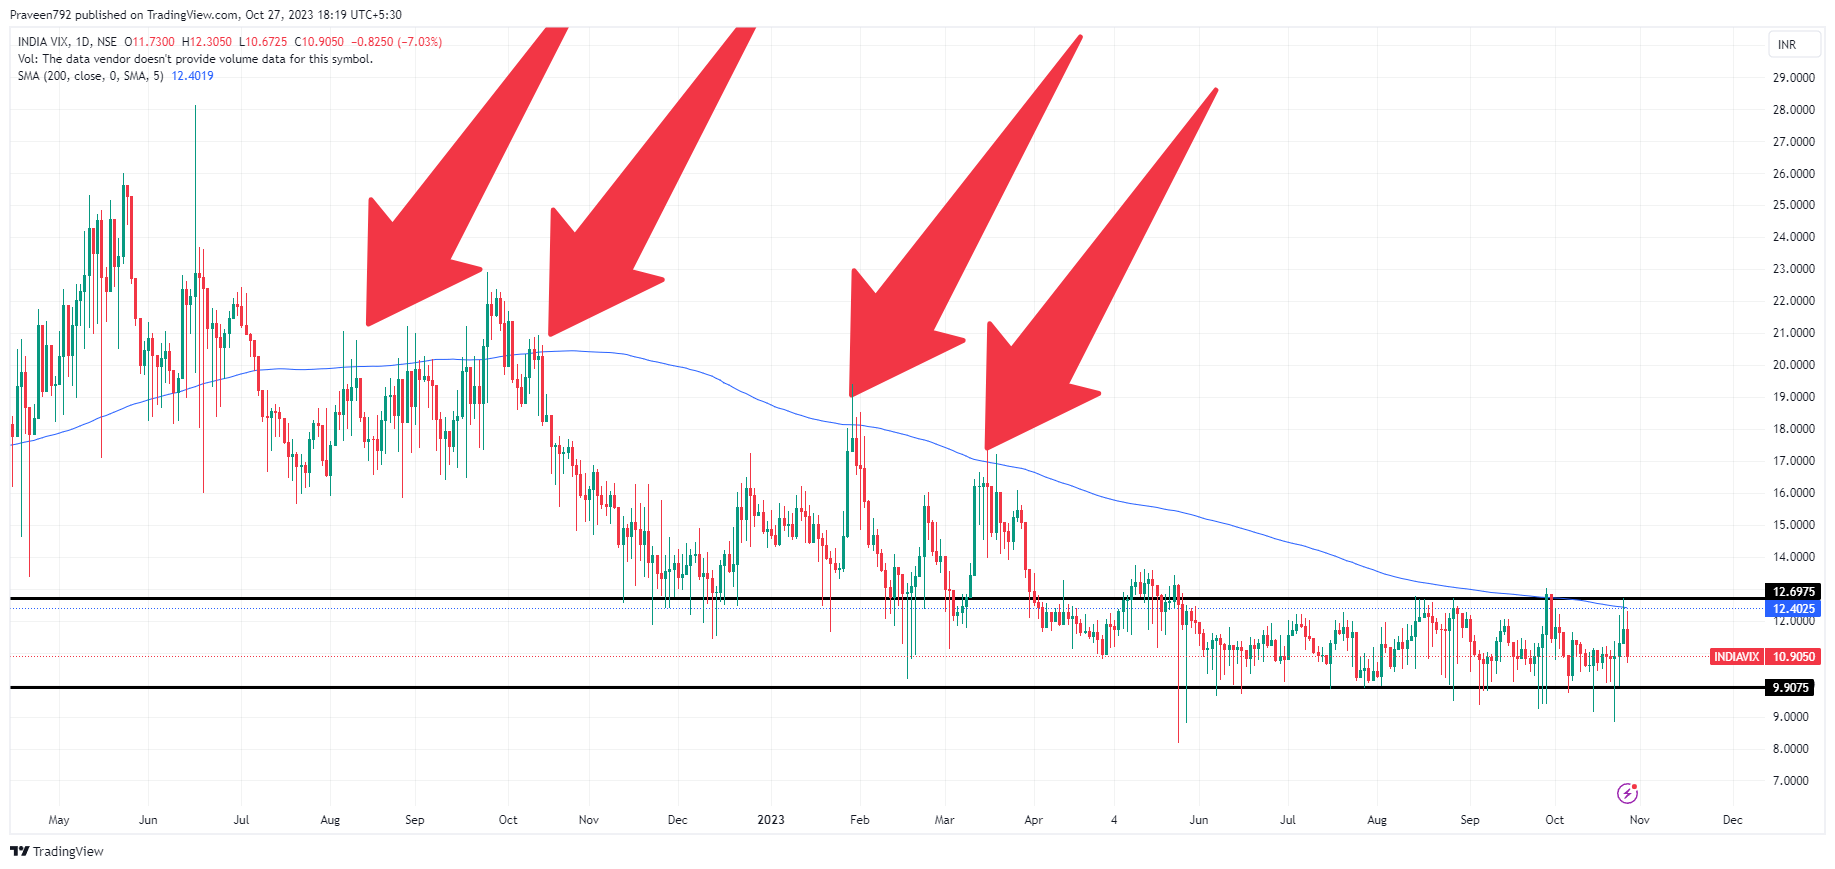
5. India VIX (Volatility Index):

   - There was something called the India VIX, which showed how jumpy Nifty was. When it was high, it meant Nifty was shaky. Right now, India VIX was around 10.9050, and it was going down, which could be a hint that Nifty might go up.


Putting all these clues together, it seemed like Nifty might have hit its lowest point and could be ready for a comeback. Do you think Nifty will bounce back?


If you're curious to learn more about stock trading, we offer a course that breaks it down in an easy-to-understand way. Contact us for details and share this story with anyone wanting to unlock the mysteries of the stock market.


Author


Frequently Asked Questions

+

Nifty is a key stock market index representing India's top 50 companies. Its performance holds significance in the financial world as it reflects the overall market health. In October 2023, Nifty's movements and various indicators are closely monitored.

+

FII Short Positions are bets made by foreign investors against Nifty. In October 2023, they held negative bets at 89%. Historically, when this happens, Nifty tends to go up the following month, creating intrigue among traders and investors.

+

Traders closely monitor F&O Rollover Data to see if others are extending their negative bets from one month to the next. In October 2023, the data indicates significant interest. How this pans out could offer insights into Nifty's potential trajectory.

+

RSI is a critical indicator used to gauge Nifty's strength. Currently, in October 2023, Nifty's RSI is around 34.99, suggesting it might be on the path to recovery. This level is closely followed by traders for market insights.

+

The 200 DMA is an important trend indicator. In October 2023, it stands at 18,612. Staying above this level is generally considered a positive sign for Nifty. Investors are keeping a watchful eye on this level for potential support or resistance.


Liked What You Just Read? Share this Post:


Viewer's Thoughts


Diapk J desai | Posted on 28/10/2023

Very good analysis. Thanks a lot to Finnowing Team

Devendra legha | Posted on 28/10/2023

Supper analysis

Aniket chingale | Posted on 29/10/2023

Acchi jankari Di aapane

Any Question or Suggestion

Post your Thoughts


Trading

Related Blogs

fear-greed-investments

Trading | 31-12- 2025

Fear & Greed in 2025: What Inv...

How fear and greed influenced investment decisions in 2025 and what market trends, risks, and opportunities investors ma...

Continue Reading
market-mood-index-signals

Trading | 31-12- 2025

Market Mood Index Signals for ...

Market Mood Index signals for 2026 reveal whether investors are driven by fear or greed. Finowings explains what it mean...

Continue Reading
nifty-50-heatmap-fii-dii-insights

Trading | 31-12- 2025

Nifty 50 Heatmap Explained: Hi...

Understand the Nifty 50 heatmap and uncover insights that FII and DII data often miss, revealing real market strength an...

Continue Reading
Renko Charts Technical Analysis: Trading Guide

Trading | 30-12- 2025

Renko Charts Technical Analysi...

Learn Renko charts technical analysis to spot trends, reduce noise, and improve trade entries with simple strategies for...

Continue Reading
Types of Leverage Used in Trading: Complete Guide

Trading | 30-12- 2025

Types of Leverage Used in Trad...

Discover the types of leverage used in trading, how they amplify gains and risks, and learn strategies to trade safely w...

Continue Reading
shooting-star-candlestick

Trading | 25-12- 2025

Shooting Star Candlestick: Mea...

All about the Shooting Star candlestick – its meaning, pattern formation, psychology, examples, and how traders use it...

Continue Reading
for a Chance to Learn Free Technical Analysis
Subscribe on
YouTube
Follow us on
Instagram
Follow Us on
Twitter
Like Us on
Facebook