Technical analysis is a study of stocks and securities to identify stock patterns, using historical market data.
Technicians use technical analysis to predict price patterns and indicate trends & reversals to identify market opportunities.
Traders and Investors use technical analysis to identify the entry and exit points of securities. It is one of the most common and important reasons to use technical data.
In market psychology, it is believed that a trend repeats itself with price movement and chart patterns. Thus, we discover the historical patterns through rigorous analysis or also try to find new developments through charting.
Technical analysis is the practice to analyse a stock through various indicators, technical charts, candle patterns, tools and more.
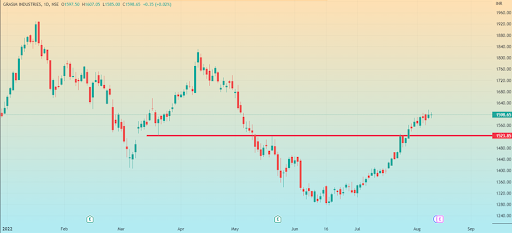
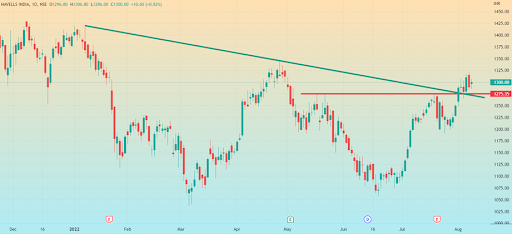
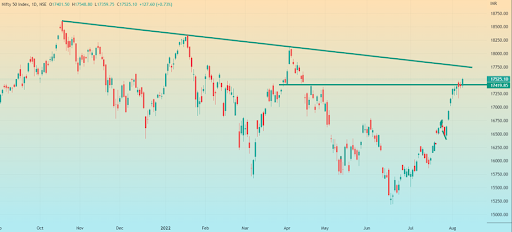
The following chart is an example for you to understand what a basic chart analysis looks like in beginner’s trading. A chart set up of security shows the use of trading lines to predict the price action.


Calm down!
We do not expect you to understand the complete Technical analysis in one day.
We expect you to understand the process.
Take in what you are learning by the time we reach deeper research.
Now, let’s move on to know the history of technical analysis.
Have you ever wondered how technical analysis originated?
Well, we did too and here is our take on it.
The technical analysis was traced in the early 17th century from the Amsterdam market. Joseph de la Vega from the Amsterdam market indicated calls, puts, speculation, and pools through his masterpiece known as Confusion of Confusions. It was published in 1688.
You must be thinking, wow! So old! How’s it even possible?
Well, here’s another piece of evidence.
It was also observed in Japan during a rice trading session in the 18th century. Homma Munehisa from Japan used candlestick patterns to trace the price of rice in the Japanese markets. He was a rice merchant and started speculating the future price of rice using technical analysis (candlestick patterns).
While the unofficial evidence was perceived in the Japanese and Amsterdam markets, the official technical analysis developed in the US market in the late 19th and 20th centuries.
Charles Dow was credited for founding the Dow Jones & Company in the US while he developed the Dow theory while studying the movement of a price index. He regularly analyses the price action of American stock markets and recorded the highs and lows from hourly, daily, weekly, monthly, quarterly, and yearly aspects.
2.1 Dow Theory: The theory states that the market shows average advances of one trend to add another trend along with the process.

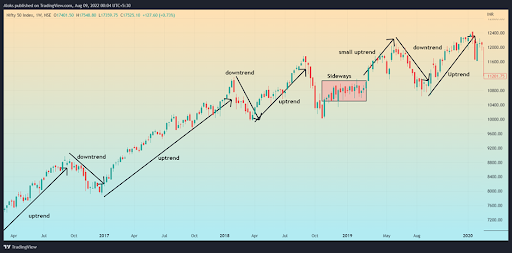
The Dow theory identifies the uptrend and downtrend through higher highs, higher lows, lower highs, and lower lows respectively. A sideways trend is also observed to predict the market trend. It helps in identifying a primary and secondary trend of security.
That’s enough about how technical analysis flourished through the years of history.
Now, what about its importance in a trader’s life?
Now, let�s move on to know the history of technical analysis.
2.2 Significance of Technical analysis
The significance of engaging in stocks and securities through technical analysis is abundant as certain events help traders and investors to make the decisions for buying, selling, and holding the stocks.
Some of the importance are as follows:
-
You can analyse the general ability of the best stock’s performance
-
You can trace the support and resistance level during price fluctuations.
-
If you’re an investor, you will understand the right time to invest and the right time to book your profits through technical analysis.
-
Using the technical analysis, day-traders anticipate the price action for the entire day and understand the market behaviour from a minute to several hours.
2.3 Three Assumptions of Technical analysis
When you’re ready to set your foot in the world of trading, you need to carefully understand the 3 Basic assumptions of technical analysis:
2.3.1 Market discounts stock action
Technical analysis assumes that a price trend will tell you everything about security and its fundamentals.
For example, if you notice a stock trading below its average price and gradually going down, there is an assumption that the earnings or market have taken a hit on that stock.
2.3.2 Price moves in trends
In technical analysis, it is assumed that price moves in trend. If a stock is lacking the foundation of developing trends, it gets critical to analyse the pattern accurately. Therefore, a stock action based on trends can help in understanding how to identify trends in stock market.
2.3.3 Price action is reoccurring
We all know the saying, ‘history repeats itself, but do you know that price action in a stock’s chart is repeating as well.
Market reaction is assumed like the past performance or historical data of the stock which makes the action reoccur in the future.
3. Tools and Techniques
Since you’ve boarded the journey to learn technical analysis, there will be lots of trading techniques and tools to learn throughout.
3.1 Volume
Volume is used as a technique by traders to perceive the rise and fall of prices.
-
Traders use volume to understand the weakness or strength of a particular stock
-
The demand and supply are calculated using the identification of changing volume. Traders expect to see an increase in volume during a breakout and a decrease in volume during a pullback.
3.2 Technical charts
-
Technical charts such as candlestick charts, line charts, and bar charts are used as tools to find the trends in pricing
-
In beginner trading, techniques such as engulfing pattern, hammer, doji, shooting star etc are observed to predict the price range.
3.3 Trading Indicators
-
Trading indicators identify the price trends using techniques provided by MACD, RACI, Moving averages, Fibonacci etc.
-
Tools for trading indicators such as average true indicator is used in technical analysis to manage your trades.
3.4 Illustration tools
-
When you’re predicting price using technical analysis, you can use drawing tools such as trend channels, trendlines and support resistance to marking your analysis.
-
In technical analysis, illustration tools play an important role as it helps in analysing the triggers and price levels.
Key Takeaways
-
Technical analysis is a trading discipline which is used by investors and traders to interpret the price actions while trading and investing.
-
History is evident that technical analysis started unofficially in the markets of Amsterdam and Japan. Later, the Dow theory developed in US markets. Dow theory is used to identify the trend through higher highs, higher lows, lower highs, and lower lows.
-
Technical analysis is important because you can understand the best time to enter and the immediate time to book your profits or losses.
-
It is assumed while conducting technical analysis that – price moves in trends, market discounts everything and price action uses historical events.
-
Tools and techniques developed through technical charts, volume, indicators and drawing tools can be used in technical analysis to perfect your trade analysis.


