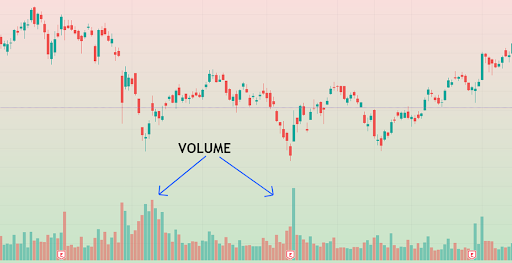
In technical analysis, volume is used to examine the market strength and determine the future price movements of a security. Read this blog to capture the knowledge on volume in stock trading.
You must know that many traders do not use volume in their trading, but many traders swear to use it during trading. Volume is used by stock market traders to analyse the number of traders buying or selling a stock at a specific price.
Remember that traders use volume to analyse the stock's price movement and measure the stock's stability in the market. It helps in indicating how many stocks are being sold or bought in the market at a specific price in a specific period.
In this blog, we will discuss the 5 volume indicators, but first, let’s understand the importance of volume and what is the best volume indicator.

Importance of Volume
In simple words, volume determines the capacity of the stock at a certain level which is produced by the number of buyers or sellers present in the market. Stock market volume analysis can help you to grab the importance of volume.
When a trader observes technical patterns for trading, the trader will always ensure the volume before entering into the trade. Suppose the analysis presented by the trader asserts that there is going to be a breakout in the chart. . .
Now, volume plays a major role here...
If the breakout is ascertained and there is an increase in the volume of buyers during breakouts, then there is a high probability of the stock being accurate as per the analysis.
See, to understand technical analysis, you need to know the purpose of all technical tools and terms. When you know the purpose of the volume, you can suitably use it, in every analysis to perform better in taking trades.
Now, what is the importance of high and low volume during trading?
High Volume
High volume interprets that when the stock is in an uptrend or near the upper circuit, more buyers are interested in purchasing the security. This portrays a high volume during an uptrend.
Similarly, when a stock is in a downtrend and near a lower circuit, many sellers are interested in selling the stock depicting a high volume of selling during a downtrend.
Thus, high volume is important because it shows a significant amount of interested buyers and sellers for a particular security.
Low Volume
The low Volume of a stock indicates that there is a lack of interest from the traders towards that stock.
Liquidity in a market is the ability to manipulate the change in price through buying and selling. Low volume is caused due to low liquidity in the market.
Stock traders ascertain that if the stock price is moving in an upward direction with a loss of volume, it is most likely to reverse into a downtrend.
If the stock price is moving down and there is a loss of volume in this situation as well from the seller’s side, traders should interpret that the downtrend has the potential to reverse.
Remember the following points:
-
Price is up > Volume is up > Bullish expectation
-
Price is down > Volume is down > Caution
-
Price is up> Volume is down > Caution
-
Price is down > Volume is up > Bearish expectation
Positive Volume Index
The Positive Volume Index (PVI) acts as an indicator in technical analysis to determine the change in prices based on the positive increase in trading volume. A trader can get this indicator while analysing a chart in trading view or any other charting software.
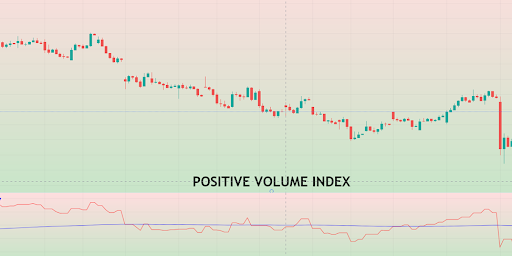
Using PVI traders can assess the strength of the ongoing trend and calculate the movement of individual securities. PVI is reliable to identify uptrends in the market when the PVI is above the moving average and helps in identifying downtrends when PVI is below the moving average.
Negative Volume Index
NVI or Negative Volume Index is an indicator in the technical analysis which will produce moves with less volume in the security’s price. It is used to identify the trends in a price of a security.
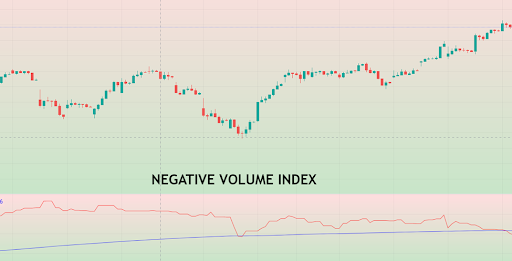
It is also known as a cumulative indicator which determines the changes in the previous price changes accumulated to present the future values. NVI helps traders in identifying bull markets when NVI moves above its one-year moving average (255-bar).
5 Types of Volume Indicators
Volume RSI
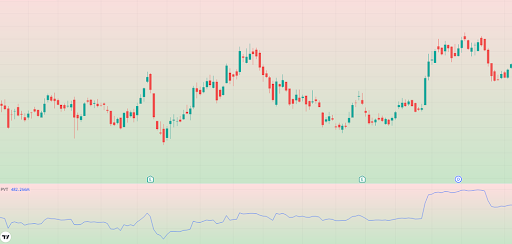
The Volume Relative Strength Index (RSI) refers to a volume indicator that helps in depicting the changes in price through changes in volume. Traders use volume indicator to trade through the signals generated from the crossovers of indicators that oscillates.
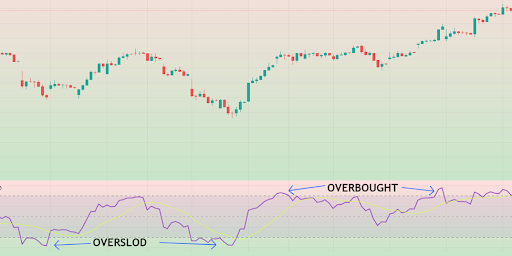
In determining Volume RSI in stock market, one should trade on the signals range from 0-100% and select trade which oscillates in 50% through the centre line. As per the figure above, you can predict the oversold and overbought area, and you need to remember the following two laws:
-
When Volume RSI is below 50% = bearish indication with bearish volume
-
When Volume RSI is above 50% = bullish indication with bullish volume
Volume Price Trend Indicator
The Volume Price Trend Indicator (VPT) is a volume indicator that analyses the direction of the security’s price and determines its strength. VPT is an indicator that interprets the price and volume while trading.
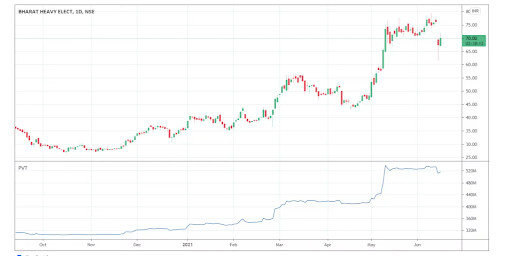
Traders should remember that a price increase will lead to an upward price trend with VPT and vice versa. You can observe the VPT from the above figure.
A decreasing volume with a price increase may indicate negative divergence with a reversal opportunity. Similarly, an increasing volume with a price decrease indicates positive divergence with upward price movement and reversal thereon.
Accumulation/Distribution
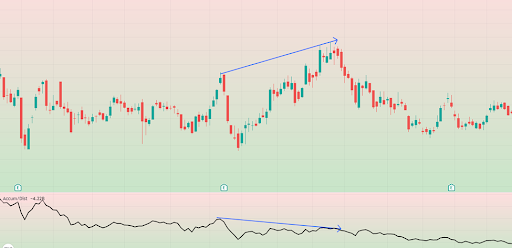
It is a volume indicator that helps in measuring the cumulative flow of the funds coming in and going out of stock.
Using accumulation and distribution indicators can help traders to find positive and negative divergences in volume and price data. The figure above shows Accumulation and distribution indicator with bearish divergence.
You should know that when accumulation takes place, it determines that traders are purchasing the stock and the distribution takes place when the market is in the selling zone.
This indicator is used to analyse the demand and supply volume in a security that drives the price movement.
Volume-Weighted Average Price
Volume weighted average price shows the average price of an asset or security which is adjusted according to its volume. It is calculated to indicate by taking the total value of the security’s price and dividing it with the volume of trades.
The meaning of weighted average is to multiply the importance of volume in trading. Traders ensure that VWAP is a technical indicator that has the strength to determine both price and volume which helps in understanding the price points of interest, relative strength and primary entry/exit points. The figure above identifies the bullish trend which is trading above VWAP.
VWAP manages to determine the entries and exit points by marking the support and resistance levels and using the average closing price as a guide. It is a versatile tool used both by traders and investors to find good equities for investment.
On-Balance Volume Indicator
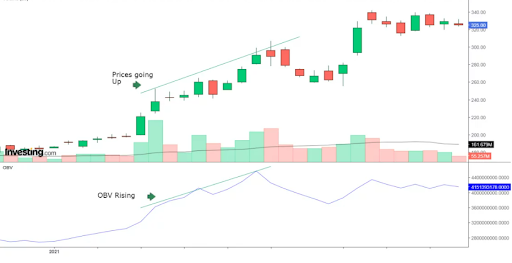
On-balance volume indicator or OBV is an indicator that predicts the price of a security through changes in volumes. Traders look at the volume to produce clear signals and carry out the trading. OBV analyses the selling and buying pressure by the volume that adds up during buying and the volume that minimizes during selling.
-
When both price and OBV are rising (as shown in the figure), then always remember that uptrend is likely to continue.
-
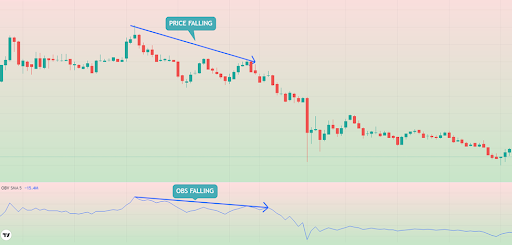
When both OBV and price are lowering down (as per the figure below) the downward trend is assumed to continue with the falling prices.
Remember the other two situations as well
-
When OBV is falling, but the price is increasing then the uptrend is likely to fail and is known as – negative divergence.
-
When OBV is rising but the price is decreasing, the downtrend is likely to fail with positive divergence.

Key Takeaways
-
Stock market traders utilize volume to analyse the number of traders purchasing or selling a stock at a certain price.
-
A trader should always analyse a volume before entering into a trade
-
High volume = stock is in uptrend = large number of buyers
-
High volume = stock is in downtrend = large number of sellers
-
Low volume = stock is in downtrend = most likely to change the direction to uptrend
-
Low volume = stock is in uptrend = most likely to change the direction to downtrend
-
When the price is up and volume is up, the security is bullish and when the price is down with volume, it is bearish in nature.
-
When PVI is above the moving average – it helps in identifying bullish trends and vice versa.
-
When NVI is above the 1-year moving average- it signals a bull market and positive trends.
-
Volume RSI below 50% = bearish indication
-
Volume RSI above 50% = bullish indication
-
VPT Decreasing volume and price increase = negative divergence
-
VPT Increase volume and price decrease = positive divergence
-
Accumulation determines purchase and distribution determines to sell
-
VWAP determines both price and volume to determine entry and exit points
-
When OBV indicates price and OBV falling = downtrend will continue
-
When OBV indicates price and OBV rising = uptrend will continue.