Introduction
The market is best known for its volatility. It remains volatile both over the long term and daily. In this situation, intraday traders continue to search for various indicators that will enable them to make the most accurate market predictions.
Before deciding to buy or sell, intraday traders use a variety of indicators to perform a technical analysis of the market and identify the current trade. Then, before investing in securities, they consider various factors.
Although traders use a variety of indicators, the super trend indicator is the first indicator that comes to mind when we want an accurate result and a precise prediction of the current trade. Moreover, compared to other indicators, this one is simple to use and understand.
Additionally, it provides highly accurate results that aid investors in making better decisions. How does the super trend indicator work? How does it assist you in determining current trade? Continue reading to learn the answers to these questions and more about the super trend indicator.
What is the Super Trend?
The super trend is the simpler and faster indicator to forecast the current market with excellent accuracy. Period and multiplier are the two parameters that it depends on. These two dynamic values assist in determining the current trend and price placement.
This indicator applies to futures, forex, and stock trading. Based on 15-minute, hourly, daily, and weekly charts, you can make predictions in the super trend indicator. There are two parameters which help in constructing an investment strategy in the indicator. You can set the value 3 for the multiplier and 10 for the true average range or ATR to get the precise result.
To use the super trend indicator, ATR is necessary. It is useful to demonstrate market volatility over a specific time frame. It decompresses the security price spectrum for that specific time.

Use of Super Trend Indicator
Utilizing this super trend indicator is very easy. To understand this indicator, you do not need to be an expert or go into great detail about technical matters. That is why it is regarded as one of the simplest indicators to determine the market's current trend.
To use the super trend indicator, follow these specific instructions:
-
Select the stock you want to trade in, then launch the chart for that stock.
-
You can do this using any reliable charting software. Set 10-minute time intervals for intraday trading.
-
Use the super trend indicator and set the parameters to 10 and 3. In the settings, you can also enter your value.
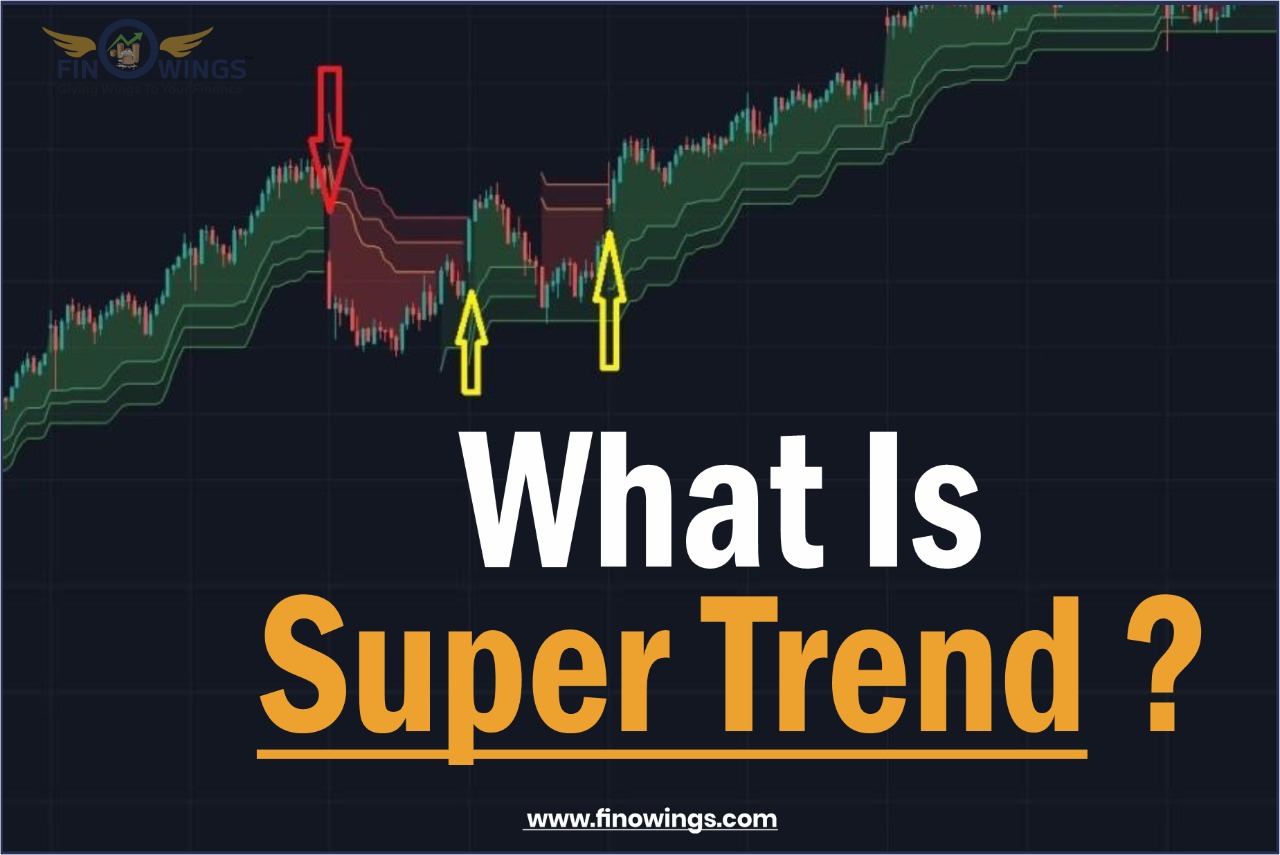
That's it. You are all set to use the super trend indicator. Use the arrows as a buying and selling signal for the stock. Watch the signals and observe the trend for a specific stock. If you want to reduce the loss, don't avoid setting stop loss in the indicator. Green and red are the two indicator lines. Set the stop loss for long positions at the green line indicator and short positions at the red line indicator.
Parameter of Super Trend Indicator
Super Trend Indicator's standard parameters are 10 and 3. Most investors use these parameters to determine the current trend and forecast the market.
Even though you can adjust these parameters to your preferred value, it may impact the super trend indicator. It is because the super trend indicator's primary goal is to provide buy and sell signals for specific stocks.
Even though there isn't a perfect way to set these numbers just yet, any changes in the number can change the entire reading. As a result, the indicator may become over-optimized with minor adjustments. On the other hand, these adjustments make it more responsive and cause it to generate more signals.
Conversely, when the indicator's settings are high, you receive fewer signals, and the market's noise is eliminated; this makes it difficult to identify accurate, current trends. Therefore, changes to the standard numbers 10 and 3 may send out the wrong signals, which may lead to you not making the best investment choices.
The formula of the Super Trend Indicator
You can use the super trend indicator to visualize the market's current trends. It is an excellent technique for making market predictions. Investors widely use this to buy and sell securities. But how do you calculate a super trend?
The super trend can be calculated using a formula. It read as follows:
Up = (high + low / 2 + multiplier x ATR
Down = (high + low) / 2 – multiplier x ATR
To calculate the ATR, you can use the following formula:
[(Previous ATR x 13) + Current TR] / 14
The period is denoted by the number 14. You can calculate the ATR by multiplying the previous ATR by 13, adding it to the most recent true range (TR), and dividing the result by the period.
The true range (TR) contains the highest number of the following:
-
Current day high minus current day low.
-
Value of current day high minus yesterday's close.
-
The value of the current day is low minus yesterday's close.
3.2 Advantages and Disadvantages of Super Trend Indicator
Super trend indicators have their benefits and drawbacks. In this section, we will discuss the advantages and disadvantages of the super trend indicators.
Advantages of super trend indicator
-
It is a simple and faster indicator in comparison to others.
-
It gives precisely accurate signals.
-
This indicator is freely accessible on many platforms.
-
It enables investors to recognize current intraday trading trends and reach decisions more quickly and accurately.
-
It can be used as a future, forex, or equity indicator.
-
It can be useful in predicting trends over a range of timescales, including hourly, weekly, daily, and so on.
Super trend indicators have the following disadvantages
-
They don't work well in all circumstances.
-
The market must be volatile for it to be effective.
-
Only analyzing short-term market trends is beneficial.
-
It only uses two dynamic values, which could produce inaccurate results under certain circumstances.
Signals to Buy and Sell Using the Super Trend Indicator
This indicator's primary objective is to provide buy and sell signals. Red and green lines can be found in the chart. These two lines instruct investors on when to buy and sell shares. The indicator tells you whether to buy or sell stocks based on color.
Selling stocks is advised when the indicator turns red because it indicates that the super trend has moved above the closing price. Hence it is the best time to sell a stock and make money off it.
On the other hand, the indicator turns green and signals to buy the stock when the super trend moves below the closing price. Essentially, it indicates that the share is better to purchase at a lower price.
You can move the arrow to identify these signals on the chart and base your subsequent moves on the green and red signals.
Final Thoughts
The super trend indicator is the widespread indicator investors use to form their investment strategy. It is simple to use and understand. This is the reason investors find it appealing. The green and red buy/sell signals for stocks give investors an idea of the current trends. This indicator does have some drawbacks, though. For instance, it performs best in volatile markets but does not produce reliable results in sideways markets. Therefore, before using a super trend indicator to create your investment strategy, you must thoroughly understand it. Agarwal Corporate is highly regarded for having the best stock market knowledge. They offer various courses that explain brilliant stock market strategies. From Agarwal Corporate, you can learn more about the super trend indicator and form the best investment strategy to earn profit.


 72.jpg)