
Speed, clarity, and discipline are critical in intraday trading. Trending indicators are used for quick market moves. One of the best and most effective is the Supertrend Indicator.
Are you looking for answers to the following questions?
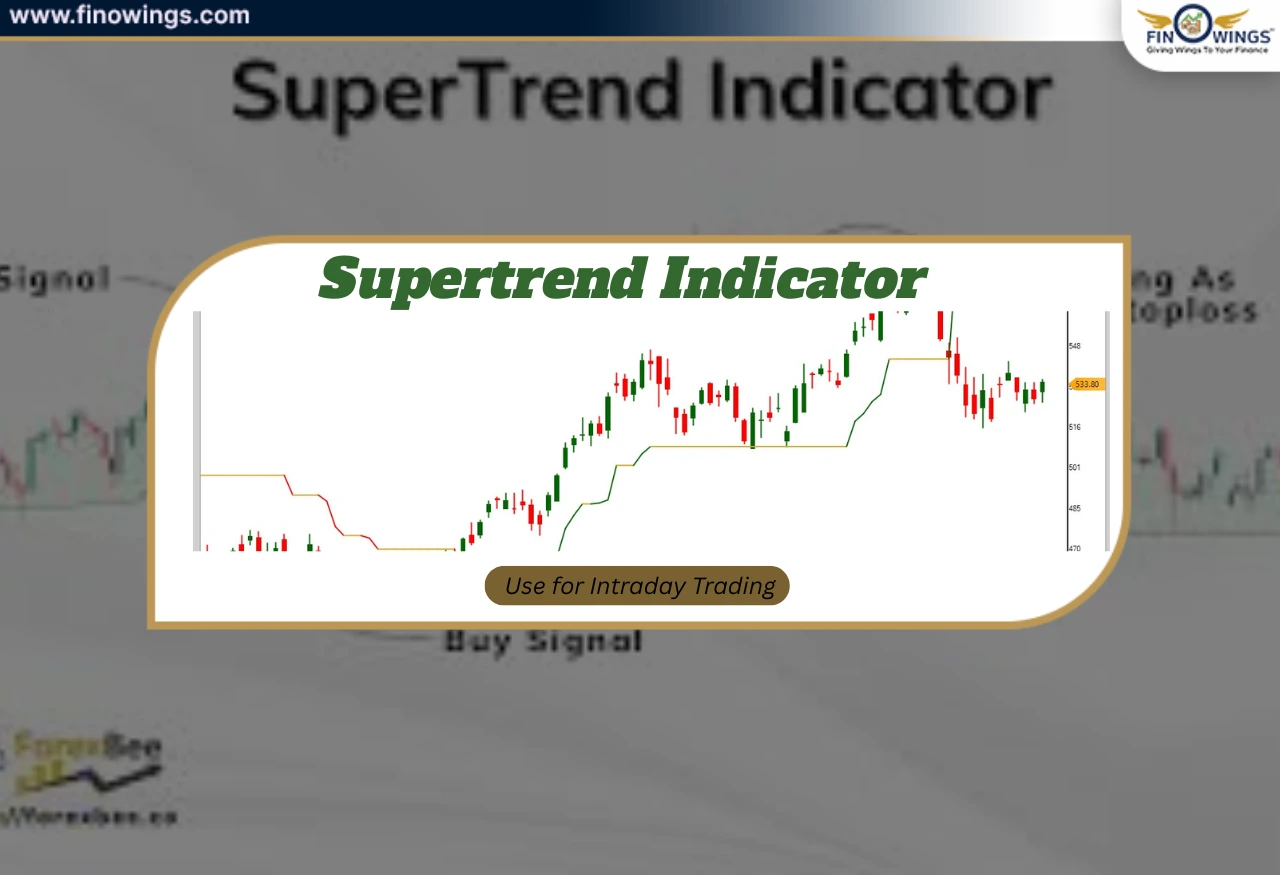
What is the Supertrend indicator?
What is the process of using the Supertrend indicator intraday?
What is the most effective Supertrend trading strategy?
What are the appropriate Supertrend indicator settings?
How would you describe the Supertrend indicator formula?
This is the guide for you!
What Is the Supertrend Indicator?
The supertrend indicator is a trend-following technical indicator that assists in determining:
- - The direction of the market (uptrend or downtrend).
- - The most appropriate points to enter or exit a trade.
- - The levels to set a trailing stop-loss.

(Source: TradingView)
Because of its clarity in buy/sell signals and the assistance it provides in making trade decisions, it has become a popular intraday trading indicator.
In simple terms, Supertrend indicates periods of valuable trading opportunities and periods to avoid market activity.

Why the Supertrend Indicator is Popular Among Day Traders
Day traders admire Supertrend because:
- - Easy to read signals
- - No headache trend detection
- - Integrated losses protection
- - Adaptable to any time interval
- - Less emotional control issues
As a result, Supertrend is widely used among novices and experts.
The Functioning of the Supertrend Indicator
Supertrend is predicated on price and volatility.
It involves:
- - ATR (Average True Range) to gauge volatility
- - Multiplier to adjust responsiveness
The indicator shifts to a different color or position in alignment with the trend direction:
- - Green = Uptrend (Favorable to buy)
- - Red = Downtrend (Favorable to sell)
Simplified Explanation of Supertrend Indicator Formula
The Supertrend indicator formula may come off as elaborate and technical, but the idea is fairly straightforward.
Key Elements:
- - ATR (Average True Range)
- - Multiplier (common choices being 2 or 3)
A Condensed Logic of the Formula:
- - Upper Band = Price + (Multiplier x ATR)
- - Lower Band = Price - (Multiplier x ATR)
What Happens When Price:
- - Rises above the band = trend is bullish
- - Declines below the band = trend is bearish
You won’t have to calculate any of this on your own - It is all done by the trading software.
Best Supertrend Indicator Settings for Intraday
Finding the best settings for this indicator is more of an art than a science, as many different combinations can be equally valid for an intraday time frame.
Most Common Supertrend Indicator Settings
|
Trading Style |
ATR Period |
Multiplier |
|
Fast Scalping |
7 |
2 |
|
Intraday Trading |
10 |
3 |
|
Swing Trading |
14 |
3 |
For a beginner, the most balanced configuration is most likely (10, 3).
With these supertrend indicator settings, trends can be identified while minimizing the number of false signals.
Supertrend Indicator Intraday Strategy (Step-by-Step)
Understanding a practical supertrend trading strategy for intraday is incredibly useful.
Strategy 1: Basic Supertrend Buy & Sell Strategy
Timeframe: 5-minute or 15-minute chart
Indicator: Supertrend (10, 3)
Buy Signal:
Price closes above Supertrend
Supertrend line turns green.
The market is not sideways.
Entry: Buy on the next candle.
Stop Loss: Supertrend line.
Target: Risk: Reward of 1:1.5 or trail SL
Sell Signal:
Price closes below Supertrend
Supertrend line turns red.
Entry: Sell on the next candle
Stop Loss: Supertrend line
Target: Trail using Supertrend
This is the simplest intraday Supertrend strategy.
Supertrend as a Trailing Stop Loss
One powerful feature of Supertrend is that it acts as a dynamic trailing stop-loss.
In buy trade → Supertrend below price
In sell trade → Supertrend above price
As the price moves in your favour, the stop loss automatically moves.
This helps,
- Protect profits.
- Reduce emotional exits.
- Ride big intraday trends.
Best Markets to Use the Supertrend Indicator
The supertrend indicator works best in trending markets like:
- Index trading (Nifty, Banknifty)
- Trending stocks.
- Commodity futures.
- Crypto markets.
- It performs poorly in sideways or choppy markets.
Supertrend Indicator and Volume Confirmation
Combining Supertrend with volume will help minimise wrong signals.
The setup should look something like this:
Supertrend buy signal.
Volume is higher than usual on the breakout candle.
This shows genuine market involvement and increases the accuracy of your Supertrend trading strategy.

Supertrend Indicator with Moving Average (Advanced)
Many traders also use Supertrend together with:
20 EMA or 50 EMA
The Buy Rules:
- Price is above the EMA
- Supertrend signals a buy.
The Sell Rules:
- Price is below the EMA and Supertrend is signalling a sell.
This will help you reduce weak trades while improving the confirmation of the trend strength.
Supertrend Indicator vs Other Intraday Indicators
|
Indicator |
Strength |
Weakness |
|
Supertrend |
Clear trend & SL |
Sideways market |
|
RSI |
Momentum |
Early exits |
|
MACD |
Trend + momentum |
Lag |
|
VWAP |
Institutional bias |
Intraday only |
Supertrend is one of the easiest to use intraday trading indicators for beginners.
Common Mistakes Traders Make with Supertrend
Tackling these is essential:
- Trading every Supertrend signal without discretion.
- Trading range markets with Supertrend.
- Over-optimizing Supertrend settings.
- Not taking higher timeframes into account.
- Ignoring all risk management.
- Remember, Supertrend improves the probability, but is not a guarantee.
How to Identify Sideways Market (When NOT to Use Supertrend)
Do not use Supertrend when:
- Price is in a very narrow range.
- Rapid alternating colour changes.
- Low price trading.
- No obvious higher highs or higher lows.
- Patience is the best approach in this case.
Supertrend Indicator for Beginners: Practical Tips
- Trading with one Supertrend indicator is ideal.
- Incorporate a higher time frame bias.
- Limit risk to 1% of your account per trade.
- Only trade trending stocks.
- Keep your emotions in check.
- In the trading world, consistency is far more important than complications.
Is the Supertrend Indicator Profitable?
Yes, but only if used correctly.
Supertrend:
- Never predicts market tops and bottoms.
- Assists in following market direction.
- Acts as a risk management tool with a trailing SL.
- To a lot of traders, Supertrend becomes a system instead of a magical indicator.
Supertrend Indicator Explained in One Line
Supertrend is a trend-following indicator that indicates when to enter, exit and trail stop-loss when day trading.
Should You Use Supertrend for Intraday Trading?
Definitely, but only with strict discipline.
The supertrend indicator is most effective when:
- The market is trending.
- There is a single, simple, clear strategy used.
- There is a strong emphasis on risk management.
- When used alongside volume and price action, Supertrend is one of the most reliable intraday trading indicators.

Conclusion
The supertrend indicator is an effective and easy-to-use tool for intraday traders. This article has examined the following: The formula for the Supertrend indicator, optimal Supertrend indicator settings, a useful Supertrend trading strategy and a list of pitfalls to avoid.
Supertrend can provide the ability to identify trends and exit with confidence when used correctly.

DISCLAIMER: This blog is NOT any buy or sell recommendation. No investment or trading advice is given. The content is purely for educational and information purposes only. Always consult your eligible financial advisor for investment-related decisions.


