Candlestick Chart Patterns: Doji Candle And Hammer Candlestick
Understand fundamental trading strategies of Candlestick Chart Patterns - Doji candle and Hammer candlestick patterns and make a shift in your trading plan. A Doji candle represents uncertainty when viewed from a broader perspective, while a Hammer candlestick suggests a trend change. Work on recognizing these patterns for better trading strategies. Let's explore these in detail.
Doji Candle
A doji is a candlestick pattern that signals market indecision. It occurs when the opening and closing prices are nearly identical, forming a horizontal line. Learning to identify and interpret doji candlesticks is crucial for pinpointing potential trend reversals.
Types of Doji Candlestick Pattern
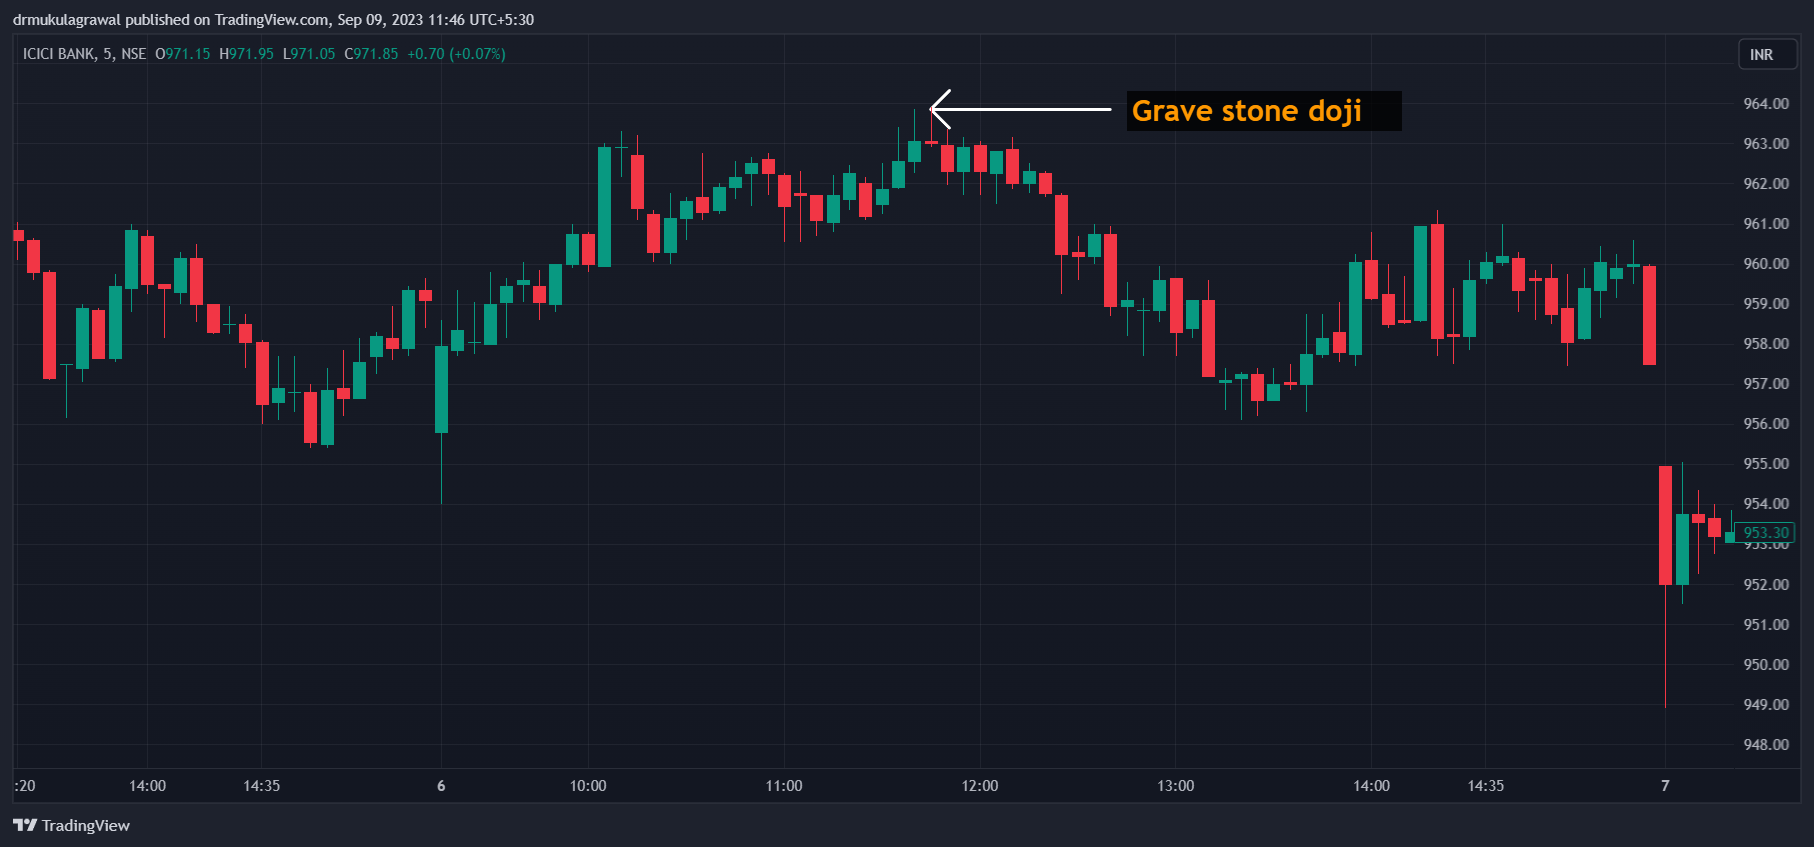
Gravestone Doji:
This doji pattern resembles an upside-down "T" and indicates a potential reversal from an uptrend to a downtrend.

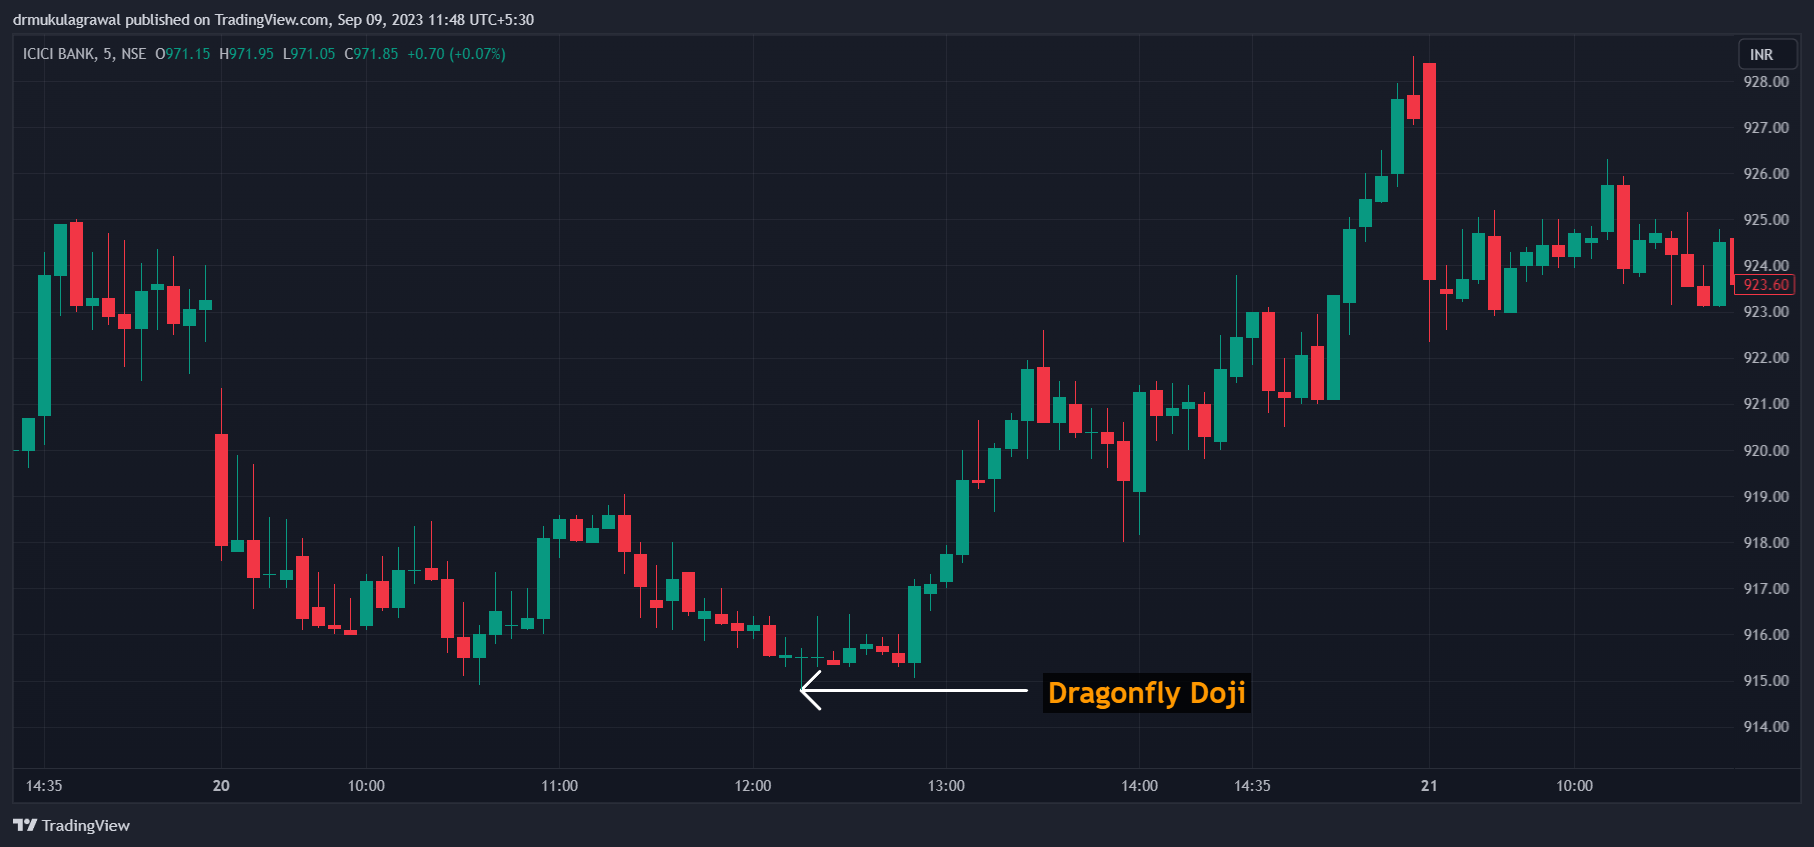
Dragonfly Doji in Uptrend:
On the other hand, a dragonfly doji, appearing as an inverted "T," suggests a reversal from a downtrend to an uptrend. Recognizing this pattern at the right time can be a game-changer.
Click to open demat account.
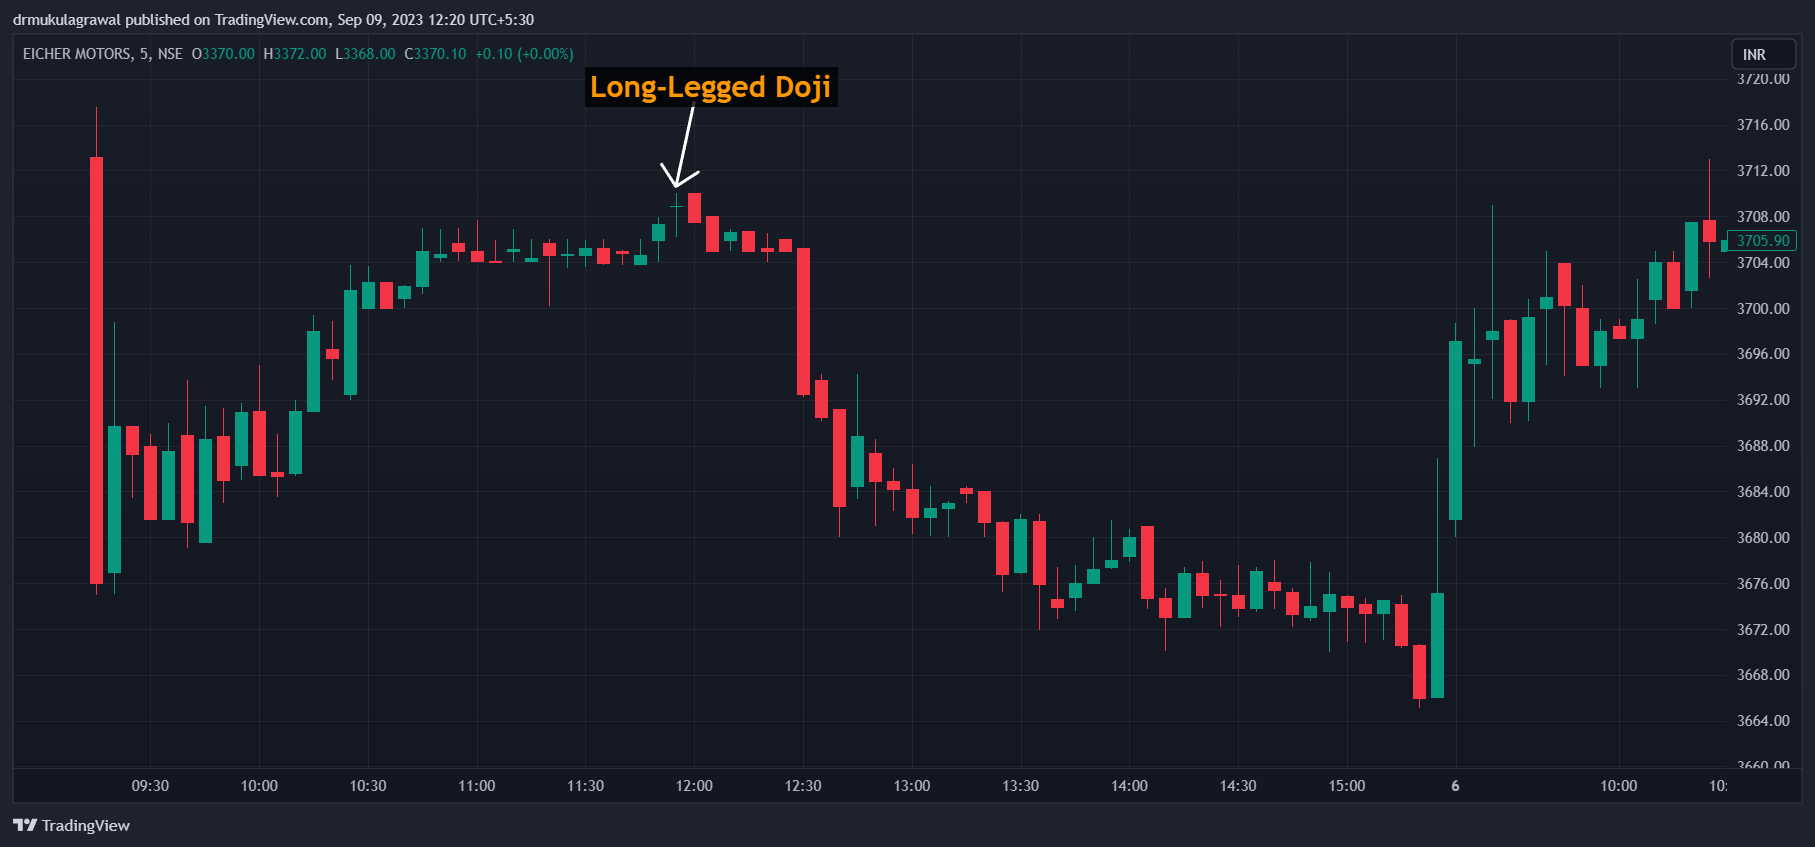
Long-Legged Doji: The Mark of Uncertainty
The long-legged doji features long upper and lower shadows, reflecting extreme price volatility and market indecision. Traders often view this as a warning sign of a potential trend reversal.
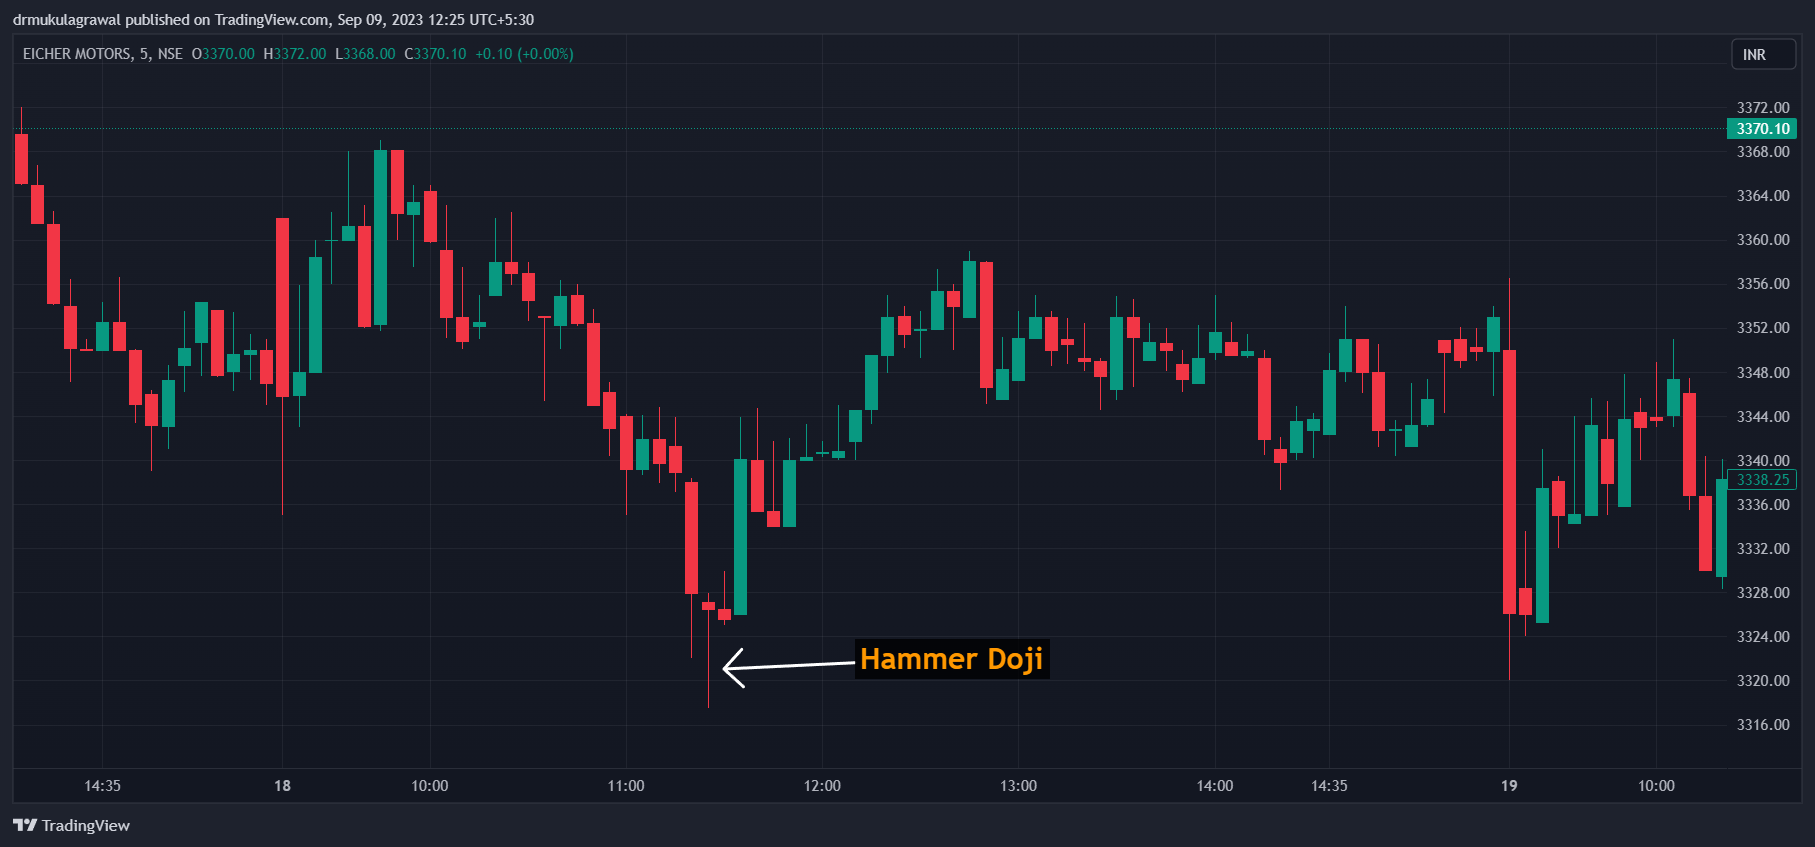
Hammer Doji: Striking a Bullish Note
A hammer doji resembles its namesake tool, with a small body and a long lower shadow. This pattern signifies a potential bullish reversal, especially if it appears after a downtrend.
Explore our Complete Guide to types of Candlestick Patterns
Bearish and Bullish Doji: Reading Market Sentiment
a. Bullish Doji: This variation suggests that bulls are gaining strength, and a reversal from a downtrend to an uptrend may be imminent.

b. Bearish Doji: Conversely, a bearish doji indicates that bears might take control, potentially reversing an uptrend into a downtrend.
Double Doji: A Double-Edged Sword
When two doji patterns appear consecutively, it's called a double doji. This rare occurrence can indicate extreme market indecision, making it crucial for traders to exercise caution.
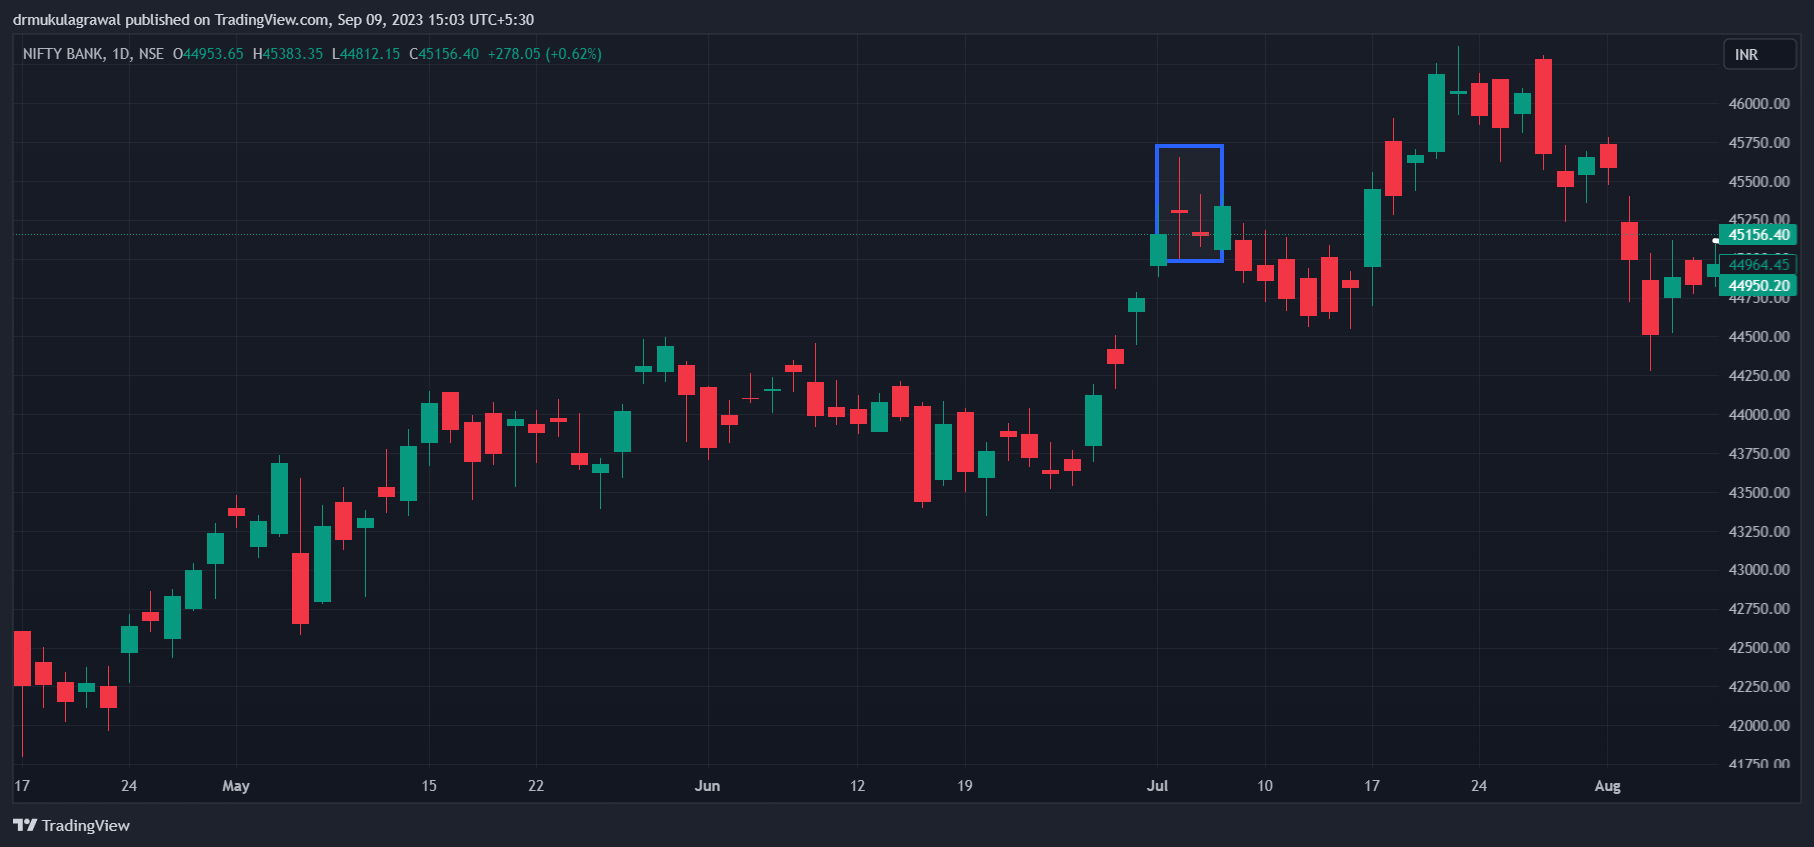
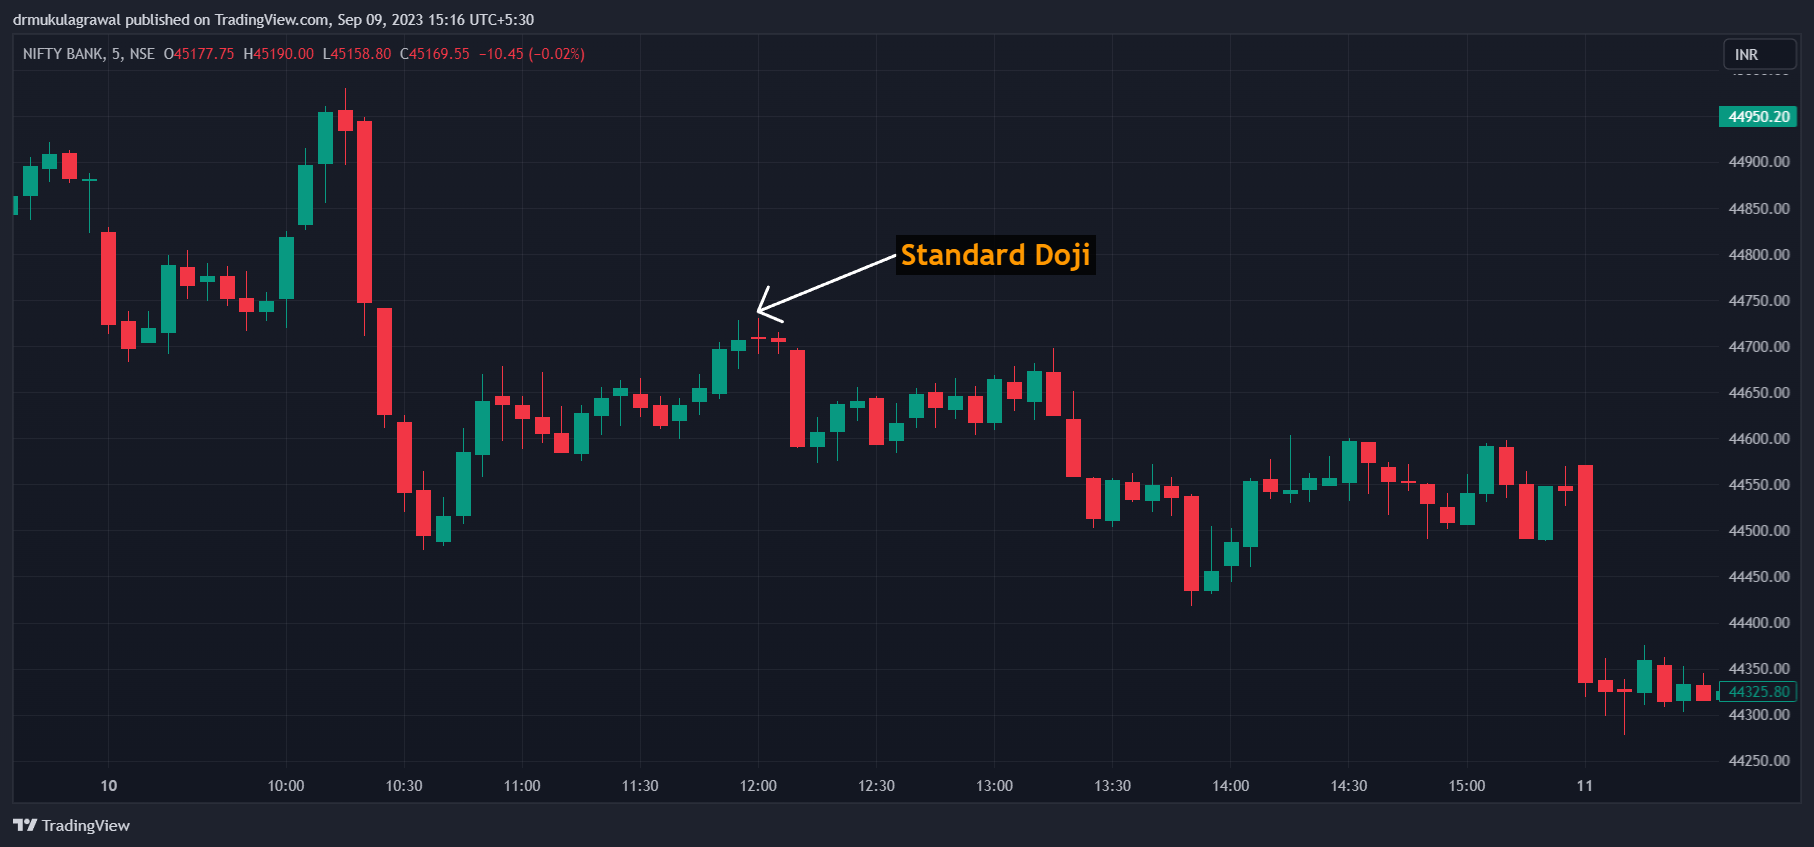
The Standard Doji: A Snapshot of Uncertainty
Sometimes referred to as the "neutral doji," the standard doji occurs when the opening and closing prices are almost identical. It's a sign that the market is at an impasse, waiting for a catalyst.
Candlestick Patterns : Hammer Candlestick And Shooting Star Candlestick Pattern
Candlestick patterns extend beyond the doji family. Other notable patterns like the hammer candlestick and shooting star candlestick also offer valuable insights into market dynamics.
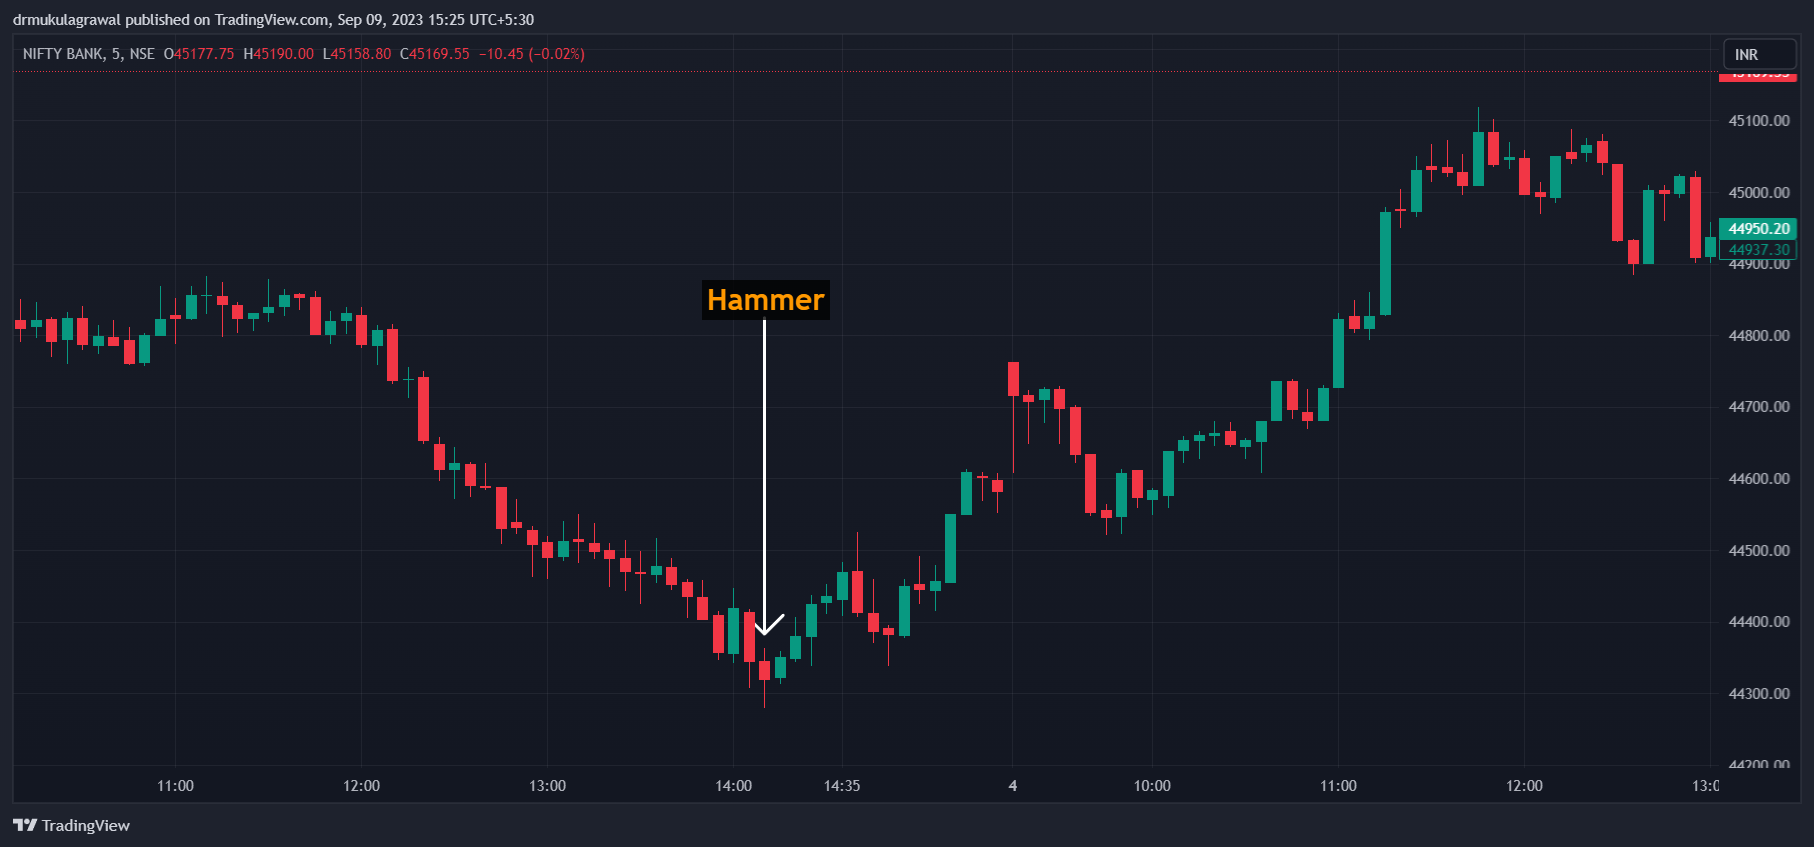
a. Hammer Candlestick Pattern : This pattern signals a potential bullish reversal when it appears after a downtrend. It's characterized by a small body and a long lower shadow.
b. Shooting Star Candlestick Pattern : A shooting star, with a small body and a long upper shadow, can indicate a potential bearish reversal if it emerges after an uptrend.
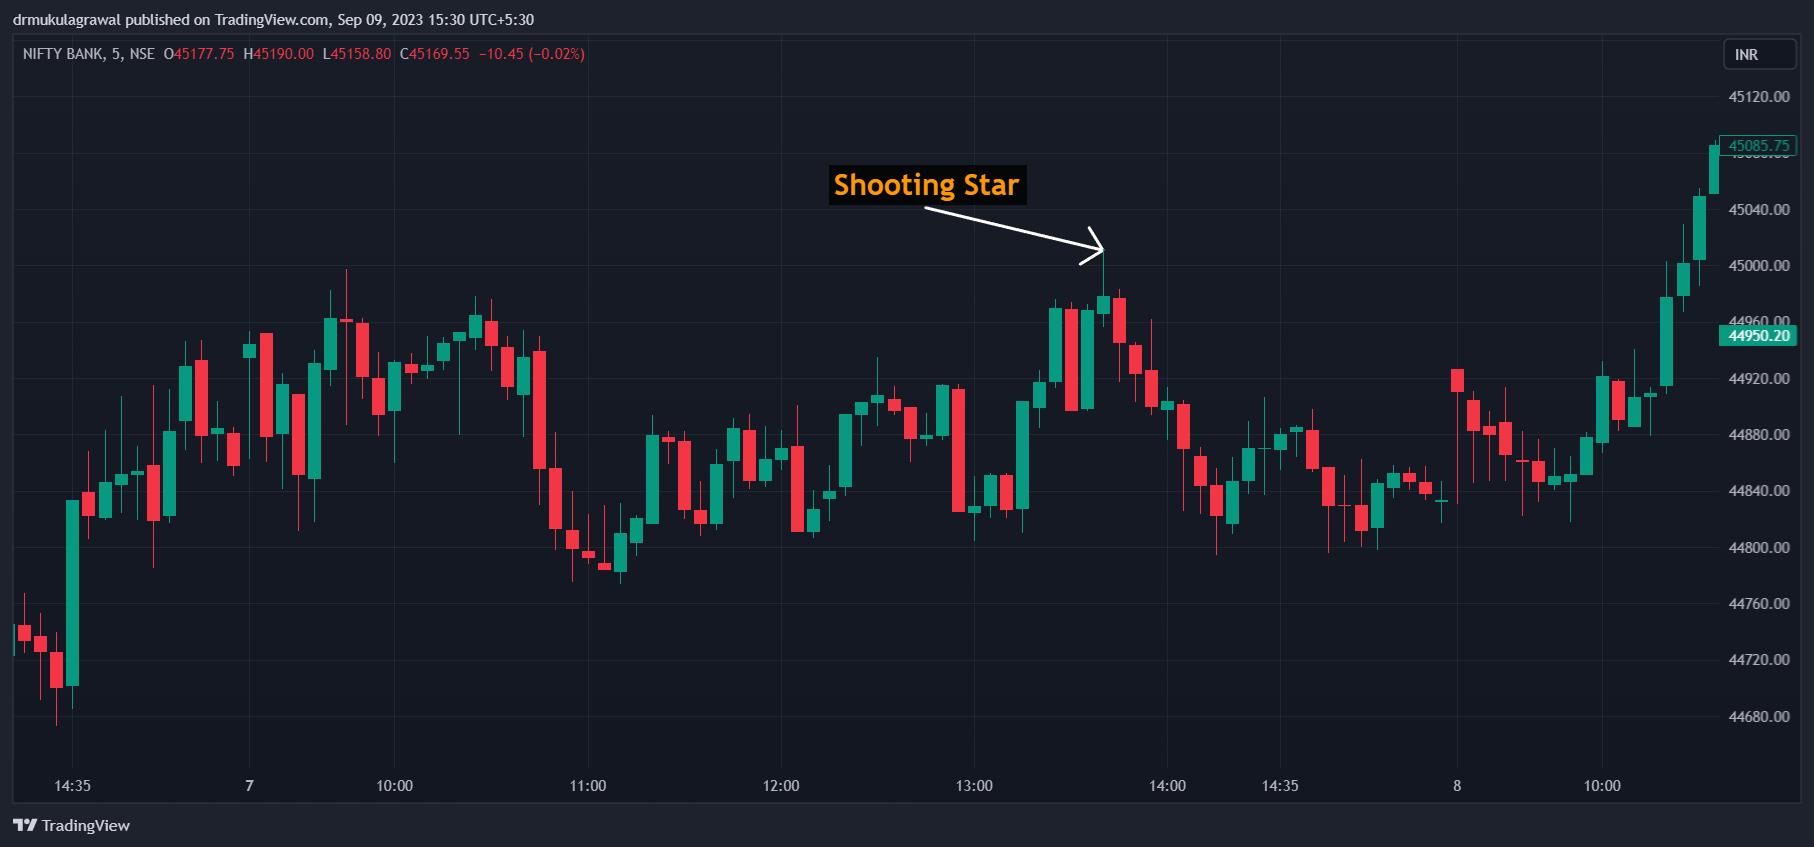
(Images Source: TradingView)
Click Here for More Detailed Knowledge about Doji Candlestick Pattern
Bullish Candlestick Patterns
Bullish candlestick patterns indicate trends that gravitate toward upward movement. They may be bullish reversal or continuation patterns.
Bullish continuation patterns have occurred in some uptrends, which forecasts that the uptrend is likely to continue.
Bullish reversal patterns occur in stocks that have been in downtrends and show that the downtrend is losing momentum; hence, an uptrend is likely to begin.
Below are Bullish candlestick patterns types for broader understanding.
-
Bullish Engulfing Pattern
Below is the image of the Bullish Engulfing Pattern-

-
Hammer & Inverted Hammer
Below is the image of the Hammer & Inverted Hammer-

-
Piercing Line
Below is the image of the Piercing Line-

-
Morning Star
Below is the image of the Morning Star-

-
Three White Soldiers
Below is the image of the Three White Soldiers-

-
Tweezer Bottoms
Below is the image of the Tweezer Bottoms-

-
Bullish Harami
Below is the image of the Bullish Harami-

Other Related Blogs
Explore 5 Types of Chart Analysis used in Technical Analysis
Discover 10 Tips to Build a Successful Career in The Stock Market
Explore Top 5 Technical Indicators for Novice Traders

Conclusion: Candlestick Chart Patterns
By helping traders recognize market indecision, prospective changes in a trend's direction, and the possibility of either price accumulation or distribution, an understanding of candlestick chart patterns such as the Doji and Hammer candles enhances trading strategies.
Hammer candles indicate broad bullish reversals following a downturn, whereas Doji candles symbolize hesitation that could result in reversals.
Combining these patterns with fundamentals like the parts of the Dow Theory gives traders insight that enhances their ability to make reasonable decisions that increase the chances of profitability. Shamelessly keep an eye on these candlestick patterns and confirm them using your other technical indicators for validation.
DISCLAIMER : This blog is NOT any buy or sell recommendation. The content is purely for educational and information purposes only. Always consult your eligible financial advisor for investment-related decisions. The author does NOT through this blog intend to involve readers in any investment or trading activities.