Imagine sitting at your desk in Lucknow or Mumbai at 9:15 AM with a hot cup of chai. The Nifty 50 chart is open on your screen. Prices are moving fast, and you feel unsure about the next move. Then you spot a colorful cloud that clearly shows whether the trend is strong or weak, where support lies, and when momentum might shift. That powerful tool is the Ichimoku cloud strategy, a complete system that gives you a full market picture at one glance.
In this beginner-friendly guide, we’ll explain the Ichimoku indicator in simple words, then explore advanced Ichimoku trading techniques like cloud twist signals, kijun sen breakout strategy, and Ichimoku multi-timeframe analysis. We’ll also cover the Ichimoku strategy for intraday trading, the best Ichimoku settings for Nifty, a detailed Ichimoku vs Supertrend comparison, and real examples from Indian markets.
You’ll get practical checklists, tables, risk rules, and tips to avoid mistakes. By the end, you’ll feel confident applying the Ichimoku cloud strategy on Nifty, Bank Nifty, or individual stocks.
What Is the Ichimoku Cloud Indicator? Simple Explanation for Beginners
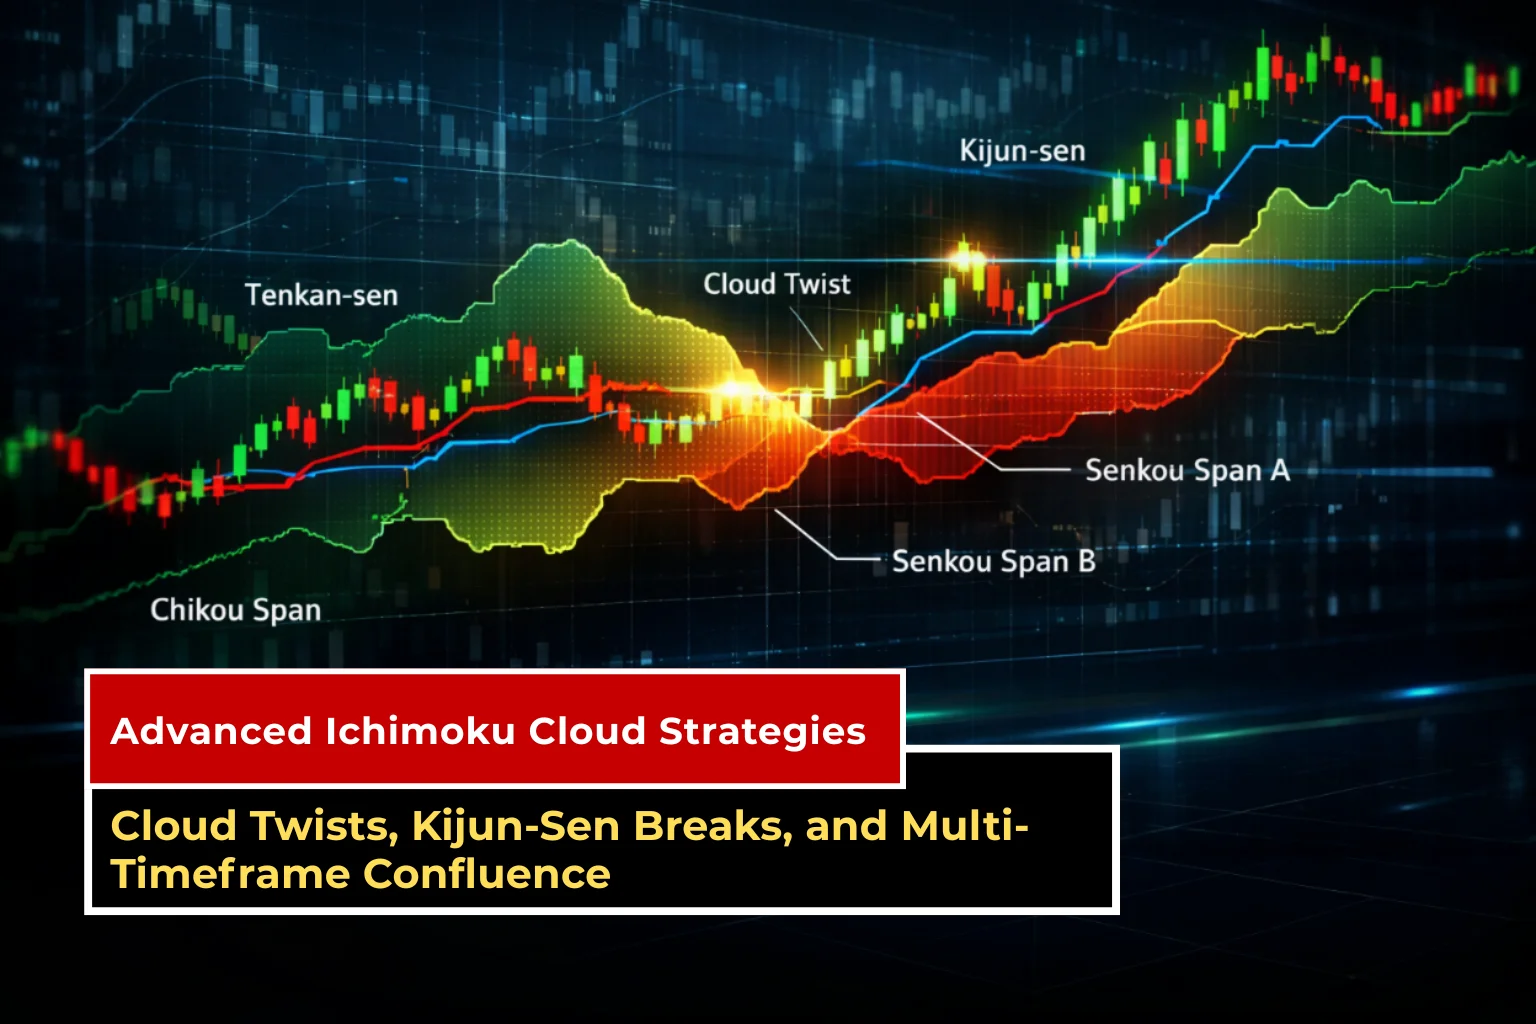
The Ichimoku Cloud, or Ichimoku Kinko Hyo, was developed in the 1930s by Japanese journalist Goichi Hosoda. It means “one glance equilibrium chart” because it shows trend, momentum, support, and resistance all together.
It uses five lines with default settings (9, 26, 52) that work well for most traders, including on Indian indices:
-
- Tenkan-sen (Conversion Line): Fast line — average of the highest high and the lowest low over 9 periods.
-
- Kijun-sen (Base Line): Stronger line, same calculation over 26 periods.
-
- Senkou Span A & B (The Cloud): Projected 26 periods ahead. The area between them is green when bullish, red when bearish.
-
- Chikou Span (Lagging Span): Today’s closing price plotted 26 periods back for confirmation.
Golden Rule: Price above the cloud = bullish trend. Price below the cloud = bearish trend. The cloud also acts as future support or resistance.
This clear visual is why the Ichimoku cloud strategy is loved by beginners and advanced traders alike.
(Source: AngelOne)
Cloud Twist Signals: Early Warning for Trend Reversals
One powerful signal in advanced Ichimoku trading is the cloud twist.
When the two cloud lines cross, Senkou Span A moves below Senkou Span B, the cloud twists from green to red. This cloud twist signal warns that bullish momentum is weakening and a slowdown or reversal may start. The opposite twist (red to green) suggests a possible bullish shift.
Because the cloud is projected forward, the twist gives you an early heads-up. A twist in a thin cloud is usually stronger. In a very thick cloud during a strong trend, minor twists can often be ignored.
Combine it with price, breaking the cloud for higher confidence.
(Source: trendspider)

Kijun-Sen Breakout Strategy: Simple Momentum Entries
The kijun sen breakout strategy is clean and effective. The Kijun-sen acts like a dynamic support or resistance line.
-
- Price breaks clearly above the Kijun-sen (with the cloud green and sloping up) → strong buy signal.
-
- Price breaks below the Kijun-sen (with red cloud) → sell signal.
Real Example: On a 1-hour Reliance chart, price consolidated near the Kijun. A strong green candle closed above it while the cloud was bullish ahead. Chikou Span confirmed. The trade captured a solid 7-8% move in a few days.
Always align with the bigger trend and place stop-loss just below the Kijun for longs (or above for shorts).
Ichimoku Multi-Timeframe Analysis: Boost Your Win Rate
Ichimoku multi-timeframe analysis is the secret to better decisions. Never trade using just one chart.
Simple approach:-
1. Daily chart → Check overall trend and cloud direction (your bias).
2. 4-hour or 1-hour chart → Look for cloud twistor Kijun breakout for entry.
3. 15-minute chart → Fine-tune stop-loss or exit timing.
When all timeframes agree, you have a strong multi-timeframe confluence. This keeps you from fighting the bigger trend.
Ichimoku Strategy for Intraday Trading
Many traders ask about the Ichimoku strategy for intraday trading. It works well but needs care.
For intraday on Nifty or Bank Nifty:-
-
- Use 15-minute and 5-minute charts.
-
- Focus on Kijun breaks and cloud direction.
-
- Trade only when the price is clearly above or below the cloud (avoid inside the cloud).
-
- Combine with a higher timeframe (1-hour or 4-hour) for bias.
-
- Best during high-volume periods like the first 2 hours or after major news.
Tip: Some traders simplify by showing only the cloud on intraday charts and pair it with Supertrend for extra confirmation.
Default settings work, but some aggressive intraday traders test slightly faster periods. However, stick to 9-26-52 until you have experience.
Best Ichimoku Settings for Nifty and Indian Markets
For Nifty 50 and Bank Nifty, the default settings (9, 26, 52) remain the most reliable for swing and positional trading. They match the natural rhythm of the Indian market week.
For pure intraday: Some traders experiment with shorter settings like (9, 26, 52) on lower timeframes or slightly faster ones, but changing settings too early often creates more noise. Test on historical Nifty charts first.
Most professional Indian traders keep defaults and focus on multi-timeframe confirmation instead of tweaking numbers.
If you want to understand this concept deeper, you can also read our detailed guide on how to trade with Multiple Time Frames Analysis, where we explain step-by-step how to align different charts for better accuracy.
How to Identify High-Quality Setups + Step-by-Step Checklist
A high-quality Ichimoku cloud strategy setup usually has these confluences:-
-
- Price clearly above/below the cloud.
-
- Cloud is thick and sloping in the trade direction.
-
- Cloud twist or Kijun breakout on the entry timeframe.
-
- Chikou Span on the correct side of the price.
-
- Volume supporting the move.
Step-by-Step Entry/Exit Checklist:
1. Daily chart confirms trend direction.
2. Lower timeframe shows a clear signal (twist or Kijun break).
3. Chikou confirms.
4. Enter on candle close.
5. Stop-loss beyond the cloud or Kijun.
6. Target at least 1:2 risk-reward or next cloud boundary.
7. Trail stop as price moves favorably.
8. Exit on the opposite signal or when the price enters the cloud.
Common False Signals and How to Avoid Them
Biggest mistake: Trading when the price is inside the cloud - this area means uncertainty. Wait for a clear break.
Other false signals: Kijun breaks in low-volume choppy markets or weak cloud twists during sideways action.
Solution: Always demand confirmation from at least two Ichimoku elements + volume. Avoid trading during low-volume hours or major holidays.
Best Market Conditions for Ichimoku Cloud Strategy
The strategy performs best in clear trending markets with moderate volatility, perfect for Nifty during earnings season or trending moves after budget announcements. It struggles in flat, range-bound, or extremely choppy conditions.
Ideal: Strong uptrend or downtrend with good participation. Avoid when the price keeps whipping inside the cloud.
Ichimoku vs Supertrend: Detailed Comparison with Examples
Many Indian traders compare Ichimoku vs Supertrend. Here’s a clear breakdown:-
|
Feature |
Ichimoku Cloud |
Supertrend |
Winner for... |
|
Information Provided |
Trend + Support/Resistance + Momentum + Future view |
Simple trend direction + trailing stop |
Ichimoku (more complete) |
|
Ease of Use |
Looks complex at first but powerful |
Very simple arrows and color change |
Supertrend for absolute beginners |
|
Best Timeframe |
Daily, 4H, 1H (swing & positional) |
5-min to 1H (intraday & swing) |
Depends on style |
|
False Signals |
Fewer in strong trends |
Can whipsaw in sideways markets |
Ichimoku in trends |
|
Intraday Performance |
Good with multi-timeframe |
Excellent for quick entries |
Supertrend for pure intraday |
|
Example on Nifty |
Cloud breakout + Kijun break catches big moves |
Supertrend flip catches short swings |
Ichimoku for bigger swings |
Real Example: In a strong Nifty uptrend, the Ichimoku cloud staying green with price above it kept traders in the move longer, while the Supertrend gave multiple re-entries on dips. Many traders combine both: Use Ichimoku for trend bias and Supertrend for precise entry timing.
Ichimoku gives you more context; Supertrend is faster and simpler. Choose based on your style or use both together.
Real Examples from Indian Markets (Nifty & Bank Nifty)
In one recent Nifty move, the price broke above a green cloud on the daily chart with Tenkan above Kijun and Chikou confirmation. The result was a solid rally of over 1,000 points.
On Bank Nifty, a bearish cloud twist on the 4-hour chart, followed by a Kijun break below, led to a quick 800+ point drop in two days. Traders who waited for the price to exit the cloud avoided false signals.
These examples show how the Ichimoku cloud strategy works beautifully on Indian indices.
Risk-Reward Framework and Beginner Mistakes to Avoid
Always risk no more than 1% of your capital per trade and aim for a minimum 1:2 risk-reward.
Top Beginner Mistakes:
-
- Entering the cloud.
-
- Ignoring higher timeframes.
-
- Taking every small Kijun cross.
-
- Changing default settings too soon.
-
- No proper stop-loss.
Fix them by following the checklist and practicing on a demo account first.
Best Timeframes Table for Different Styles
|
Trading Style |
Recommended Timeframes |
Focus Areas |
|
Intraday |
5-min / 15-min + 1-hour |
Kijun breaks, cloud direction |
|
Swing Trading |
1-hour / 4-hour + Daily |
Cloud twists + multi-timeframe |
|
Positional |
Daily + Weekly |
Overall cloud trend + Kijun breaks |

Conclusion
You started as a confused trader watching Nifty waves. Now you have a complete Ichimoku cloud strategy from basics to advanced Ichimoku trading, cloud twist signals, kijun sen breakout strategy, Ichimoku multi-timeframe analysis, intraday tips, best settings for Nifty, and a clear Ichimoku vs. Supertrend comparison.
Open TradingView or Zerodha Kite today, add the Ichimoku indicator, and practice one setup on Nifty. Trade small, follow rules, and let the cloud guide you. Discipline + this system can give you a real edge in Indian markets.

DISCLAIMER: This blog is NOT any buy or sell recommendation. No investment or trading advice is given. The content is purely for educational and information purposes only. Always consult your eligible financial advisor for investment-related decisions.