
It is no news that shooting star candlesticks are considered to be the strongest bearish reversal candlestick patterns. Trading shooting star candlestick patterns allows you to spot market tops and pick very profitable trades.
In this piece, we explain the shooting star candlestick meaning, the trading strategy for the shooting star candlestick patterns and the common mistakes.
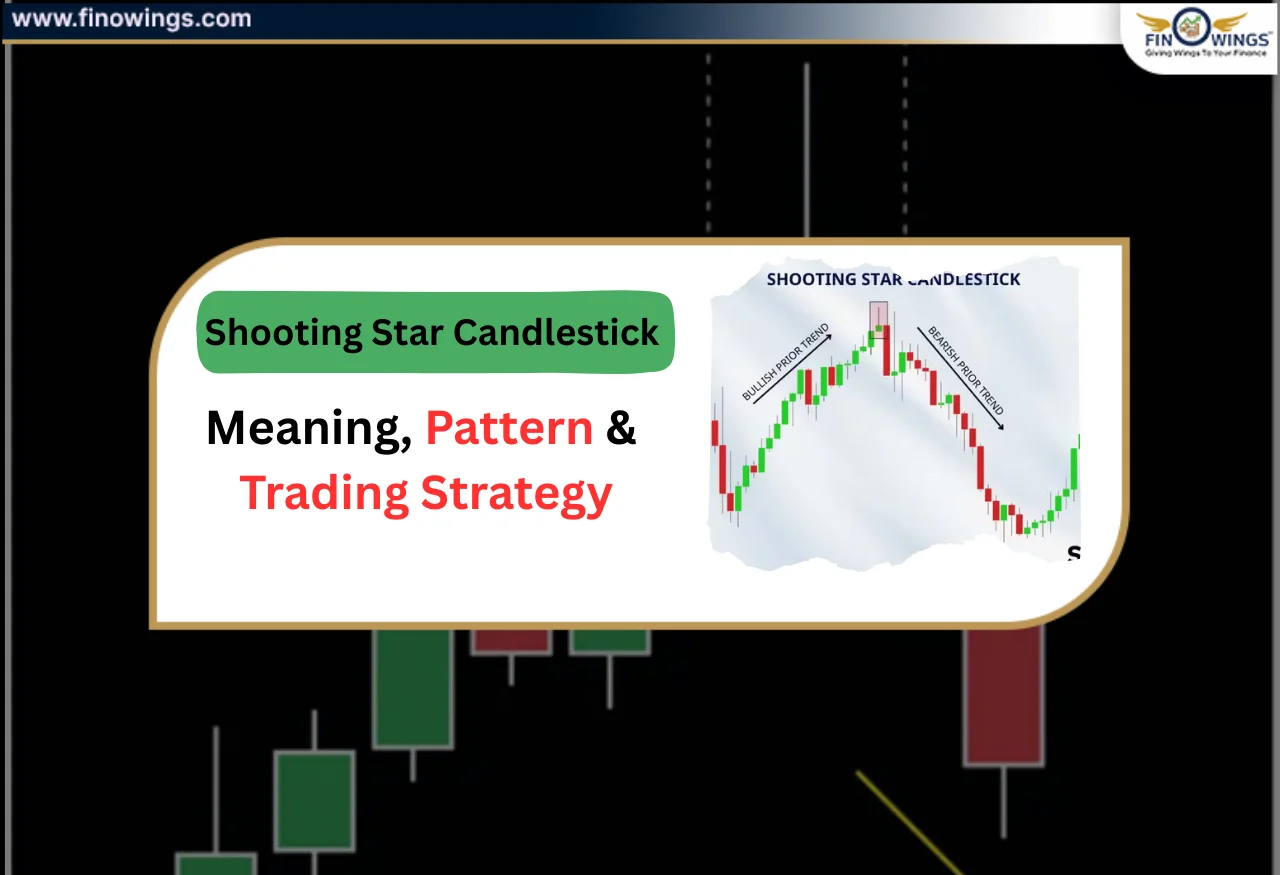
What Is A Shooting Star Candlestick?
Shooting star candlesticks are an example of single candlestick bearish reversal patterns that occur after an uptrend.
This means that,
- Some buyers pushed the price up.
- Strong sellers entered after the price got to higher levels.
- The closing price of the candle is right where the candle opened.
- This means that there is weak buying pressure and there is a possible trend reversal.
Simple Shooting Star Meaning
A shooting star indicates that "Sellers are overpowering the market after buyers could not maintain control." Shooting star candlesticks show that selling pressure is growing, bullish control is diminishing, and a price decline is probably imminent.

Shooting Star Candlestick Structure
Valid shooting star candlestick patterns consist of the following:
1. Small real body
Prices open and close are relatively close.
2. Long Upper Wick (shadow)
The wick must be at least double the length of the real body.
3. Little or No Lower Wick
The presence of a lower shadow is highly rare.

(Source: Lite Finance)
Important
The shooting star can be either red or green in colour but red shooting stars are viewed as bearish.
The Shooting Star Patterns and Their Uses
The shooting star candlestick pattern often appears in:
- - Daily
- - Intraday (5 min, 15 min, 1 hour)
- - Weekly charts (strongest signal)
It's used for/ in:
- - Stocks
- - Indices (Nifty, Bank Nifty)
- - Forex
- - Crypto
Why Is It A Shooting Star Bearish Signal
The psychology behind shooting star candlestick patterns is:
1. The market opens near the bottom.
2. Buyers push the price sharply and quickly in an upward direction.
3. More sellers enter, but only at the higher price levels.
4. The price drops all the way to the new opening price.
This reflects rejection of higher levels.
Shooting Star vs. Inverted Hammer
The shooting star pattern is often confused for an inverted hammer.
Feature Shooting Star Inverted Hammer
- - Trend: After an uptrend, after a downtrend.
- - Signal: A bearish reversal, bullish reversal.
- - Market Meaning: The trend will fall. The trend will rise.
Same candle shape, but context changes everything.
How to Confirm a Shooting Star
Once again, a shooting star is not enough. You will need confirmation.
1. Confirmation Candle
The next candle must close below the shooting star low. This confirms the selling pressure.
2. Volume Confirmation
There should be high volume during the shooting star.
This indicates strong institutional selling.
3. Shooting Star Near Resistance
Shooting stars work best near resistance.
This could be a previous high, a trendline, or a moving average.
Shooting Star Trading Strategy
Let’s understand a simple shooting star trading strategy that beginners can follow.
Step 1. Identify The Uptrend
The price should be making higher highs and higher lows.
Step 2. Look For The Shooting Star
Look for a candle with a small body and a long upper wick that appears near resistance.
Step 3. Wait For Confirmation
Wait for the next candle to be bearish.
This will help you avoid an early entry.
Step 4. Entry Point
Enter by selling on the low of the shooting star.
Step 5. Stop Loss
Set a stop loss above the high of the shooting star.
Step 6. Target
Set your target at the previous support level or use a 1:2 risk-reward ratio.
Shooting Star Trading Example
Imagine a stock moving from Rs. 900 to Rs. 1,050.
- A Shooting Star candlestick formation occurs at Rs. 1,050 resistance.
- The next candle closes below the shooting star’s low.
- The entry price would be Rs. 1,030.
- The stop loss is set at Rs. 1,060.
- The target profit is Rs. 980.
This is an example of a high-probability bearish trade setup.

Best Indicators to Combine with Shooting Star
The following indicators can be used alongside candlestick patterns for better accuracy.
1. RSI (Relative Strength Index)
An RSI above 70 alongside the shooting star indicates strong bearish pressure.
2. Moving Averages
The shooting star candlestick formation is most effective near the 50 EMA or the 200 EMA resistance.
3. MACD
Watch for a bearish crossover after the shooting star pattern.
4. Volume Indicator
An increase in the volume of the candlestick formation signals further consolidation of the trade.
Shooting Star in Intraday Trading
When used in conjunction with the other indicators and not in a sideways market, the shooting star candlestick formation is especially effective for intraday trading. The best trading timeframes for intra-day shooting star trading patterns are 5-minute and 15-minute.
Best scenarios for trade setups to take place are:
- When the shooting star candlestick pattern occurs near VWAP resistance levels.
- When the shooting star candlestick pattern occurs near the previous day’s high resistance levels.
- When there are high volume levels preceding the shooting star candlestick formation.
- Shooting star patterns are much less effective during sideways price action.
Shooting Star in Different Markets
1. Stock Market
- Used for momentum stocks.
- Strong at resistance zones.
2. Index Trading
- Performs effectively in Nifty & Bank Nifty.
- Combine with option strategies in selling.
3. Crypto Trading
- Increased volatility brings about false signals.
- Always utilise confirmation.
4. Forex Trading
- Best with higher timeframes.
- Avoid during significant news events.
Common Mistakes Traders Make
- Trading without confirming.
- Overlooking the trend direction.
- Shooting star in sideways markets.
- Omitting stop loss.
- Over-leveraging.
Remember: There is a high likelihood for outcomes based on candlestick patterns to happen, but not a guarantee.
Advantages of Shooting Star Candlestick
- Identification is straightforward.
- Applicable across various markets.
- Attractive risk-reward profile.
- Appropriate for short-selling plus position exits.
Limitations of the Shooting Star Pattern
- Low volume results in false signals.
- Not very dependable in volatile markets.
- Needs confirmation candle.
- Cannot stand alone.
Shooting Star vs Other Candlestick Patterns
|
Pattern |
Signal |
|
Shooting Star |
Bearish reversal |
|
Hammer |
Bullish reversal |
|
Doji |
Indecision |
|
Engulfing |
Strong reversal |
Is Shooting Star Reliable for Beginners?
Yes, if used correctly. Beginners should:
- Trade on higher timeframes.
- Use a strict stop-loss.
- Combine with trends & indicators.
- Practice on paper trading first.
Final Thoughts
The shooting star candlestick is a key pattern that indicates the market is reversing and helps determine possible market tops. This allows the trader to accurately short the market. With the shooting star trading strategy, the trader can become more risk-averse. Being able to understand the shooting star candle pattern and combining it with discipline and strategy will allow the trader to improve their trading.
The shooting star candlestick pattern works best with patience and discipline. It allows the trader to determine possible market tops and allows them to protect the profit or short the market with higher accuracy.
Keep in mind:
One candle does not change the market - confirmation does.


DISCLAIMER: This blog is NOT any buy or sell recommendation. No investment or trading advice is given. The content is purely for educational and information purposes only. Always consult your eligible financial advisor for investment-related decisions.


