Home >> Blog >> What Is PEG Ratio? Meaning, Formula & Importance
What Is PEG Ratio? Meaning, Formula & Importance

Table of Contents
The P/E ratio is something we look into when deciding whether a stock is expensive or cheap. However, this approach is naive. The P/E ratio does not account for a company’s growth rate. This is where we need to utilise the PEG ratio.
Long-term investors like Peter Lynch appreciate this ratio since it gives a complete picture. In this blog, we will discuss what is PEG ratio, PEG ratio formula, its usage, what the ideal PEG ratio is, and how to determine the best PEG ratio stock to build long-term wealth.
What is PEG ratio?
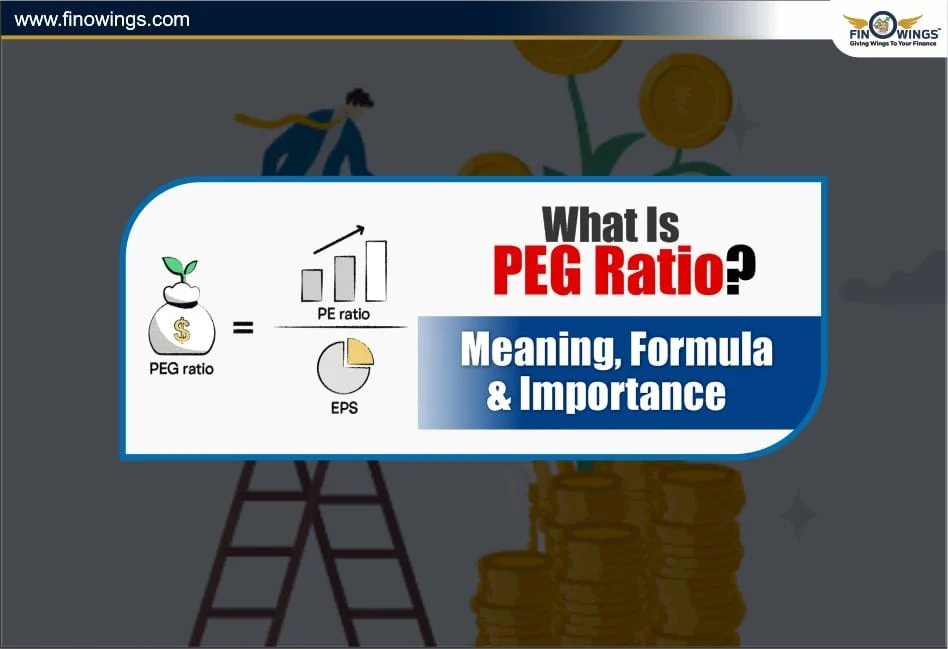
PEG ratio = Price/Earnings to Growth Ratio
In essence, it is trying to determine whether a stock is fairly priced after considering its future earnings growth.
While the P/E ratio explains how much you would pay for each pound of earnings, the PEG ratio values this and then adjusts this measure depending on how fast the company is growing.
PEG Ratio Meaning:
PEG ratio is one of the most powerful tools of valuation for fundamental investors trying to determine whether a stock is undervalued, fairly priced, or over-priced, considering the growth of its earnings. The PEG ratio shows how expensive or cheap a stock is while taking into consideration how fast its earnings are growing.
Interpretation:
If growth is high → PEG will be lower
If growth is low → PEG will be higher
This is what makes the PEG ratio a more balanced tool to use for valuations when compared to the P/E ratio.
PEG Ratio Formula
The formula for the PEG ratio is quite simple.
PEG Ratio = (P/E Ratio) / (Earnings Growth Rate)
Where:
P/E Ratio = Price / Earnings per share
Growth Rate = Expected earnings growth rate (usually 1–3 years).
Example:
Assuming P/E = 20, Expected earnings growth rate = 10%
In this case, PEG Ratio = 20 / 10 = 2
This shows that the stock is trading at 2x its growth ratewhich can be considered expensive.
How to Calculate PEG Ratio Step by Step
Step 1. Get the stock's P/E Ratio.
You can acquire this from Screener, Moneycontrol etc.
Step 2. Determine the Past or Expected Growth Rate of the Earnings.
You can use:
-
The EPS CAGR for the last 1 to 3 years.
-
Growth forecasts provided by analysts.
-
The historical growth trends of the company.
Step 3. Use the PEG Ratio Formula.
Divide the P/E ratio with the growth rate.
Step 4. Explain the Result.
PEG < 1 → is undervalued.
PEG = 1 → is fairly valued.
PEG > 1 → is overvalued.
The calculation is very straightforward and helps to pick the stocks with the right PEG ratioand can be kept for a long-term investment.
What Is a Good PEG Ratio?
The best PEG ratios differ based on the type of business and the industry.
|
PEG Ratio |
Meaning |
|
< 1 |
Undervalued; good for buying |
|
= 1 |
Fairly valued |
|
> 1 |
Overvalued |
|
> 2 |
Very expensive |
Why PEG < 1 is preferred?
Because it indicates:
-
The company’s growth is higher than what the market is pricing in.
-
The stock may be undervalued.
-
Future returns could be better.
-
This is why investors specifically screen for the best PEG ratio stocks before investing.
Why PEG Ratio is Better than P/E Ratio
Using the P/E ratio is what a lot of investors do, but it has big limitations. One limitation is if a high-growth company has a high P/E, that doesn’t mean it’s overvalued. In fact, it could be cheap for the growth.
Benefits of PEG Ratio
-
Adjusts valuation based on growth.
-
Helps compare companies from different sectors.
-
Highlights high growth opportunities.
-
Prevents buying overhyped stocks.
-
Helps find genuinely undervalued companies.
-
This makes the PEG ratio extremely useful for long-term investors.
Limitations of the PEG Ratio
-
Growth potential is not guaranteed.
-
Not suitable for cyclical stocks (i.e. Metals, Commodities).
-
Does not consider levels of debt.
-
Does not account for business risks or competitive challenges.
Importance of PEG Ratio
The PEG Ratio is an important investing metric for the following reasons:
i. Recognising Imperfect Valuation of Growth Stocks - Low PEG ratios indicate undervalued growth stocks.
ii. Recognising Overvaluation of Growth Stocks - Growth stocks may appear expensive when looking at the P/E ratio, but may actually not be when taking future growth and earnings into consideration.
iii. Cross-Sector Comparison - The PEG Ratio allows for comparison across different sectors.
The PEG Ratio is an effective investment metric; however, it should be used in conjunction with other investment ratios, including the Return on Equity (ROE) ratio, debt to equity ratio and earnings stability.
Best PEG Ratio Stocks
The best PEG ratio stocks have specific characteristics. Look for companies that have:
-
Stable and increasing earnings
-
Competitive advantages
-
Low debt
-
High return on equity
-
Steady growth for the past three to five years
-
PEG ratio lower than 1.
Examples include the screeners like Screener, Ticker, or Moneycontrol to sift through stocks in a short time.
Conclusion
While there are several ways to value a company, the PEG ratio is the most effective growth stock detection methodology. This is because it combines two elements, earnings and growth, which helps eliminate companies that are overvalued while helping detect those that are relatively undervalued. In short, it helps detect hidden growth stock opportunities. Generally, stocks with a PEG ratio of below 1 are worth the value of in-depth stock research.
Investors aiming to build a portfolio with a longer time horizon must grasp the PEG ratio meaning and apply the PEG ratio formula while practising the best PEG ratio stocks strategy in order to enhance their investment choices towards growth.
DISCLAIMER: This blog is NOT any buy or sell recommendation. No investment or trading advice is given. The content is purely for educational and information purposes only. Always consult your eligible financial advisor for investment-related decisions.
Author
Frequently Asked Questions
A PEG ratio below 1 is generally considered good because it indicates the stock is growing faster than what the market has priced in. Long-term investors prefer PEG < 1 because it suggests the company may be undervalued relative to its future earnings growth. However, what’s “good” can vary across industries—fast-growing tech stocks may have slightly higher PEGs, while stable sectors like FMCG often have lower PEGs.
The P/E ratio tells you how much investors are willing to pay for each rupee of earnings, but it does not consider growth.
The PEG ratio corrects this by dividing the P/E by the company’s earnings growth rate.
This makes PEG a more balanced valuation metric, especially for high-growth stocks that may look expensive based on P/E alone.
To calculate PEG ratio, follow these steps:
-
Find the stock’s P/E ratio from Screener, Moneycontrol, or Ticker.
-
Check the earnings growth rate—use EPS CAGR for 1–3 years or analyst estimates.
-
Use the formula:
PEG Ratio = P/E Ratio ÷ Earnings Growth Rate (%) -
Interpret the result:
-
PEG < 1: undervalued
-
PEG = 1: fairly valued
-
PEG > 1: overvalued
This calculation helps filter fundamentally strong, growth-oriented companies.
-
No, the PEG ratio has limitations. Growth forecasts can be uncertain, and PEG doesn’t consider debt, cyclicality, management quality, or business risks. It also doesn’t work well for companies with unstable earnings, such as commodity and metal stocks. Investors should use PEG along with ROE, debt-to-equity, cash flows, and qualitative factors.
Yes—historically, many multibagger stocks had PEG ratios below 1 during their early growth phases. A low PEG can signal high potential when paired with:
-
consistent earnings growth
-
strong fundamentals
-
competitive moat
-
low debt
-
high return on equity
While PEG alone cannot guarantee multibagger returns, it helps uncover undervalued growth opportunities that the market has not fully priced in.


