
If you have seen a company’s stock data, you would have seen P/E Ratio, or Price Earnings Ratio. The P/E Ratio is one of the core constituents of a fundamental analysis. This enables the owner to gauge the value of a stock relative to its earnings.
In this piece, we will discuss what constitutes a good P/E Ratio, the P/E Ratio formula, and the P/E Ratio’s interpretation as a good investment tool.
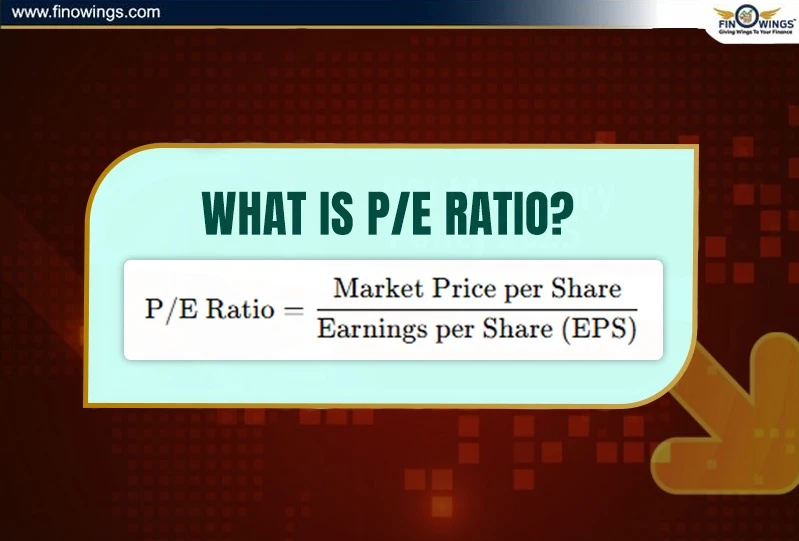
What is the P/E Ratio?
The P/E Ratio (Price to Earnings Ratio) is a valuation tool that determines the value of every inch of a company’s earnings. This means, you can use the P/E ratio to check how much potential a stock has as an investment.
The value of a stock can be calculated using the formula below:
P/E Ratio = Market Price per Share ÷ Earnings per Share (EPS)
Let’s say a company has a stock price of ₹200 and earnings per share of ₹20. The company’s P/E ratio will be 10. Here, you can say, an investor is paying ₹10 for every ₹1 earning of the company.
Understanding the Price Earnings Ratio
Understanding the Price/Earnings Ratio is very important because it compares companies by different sectors, industries, or even different time frames. This is a very useful tool because it shows market sentiment and growth expectations.
Higher P/E ratio means that the potential future growth is expected and investors are willing to pay more for it.
Lower P/E ratio means that the potential growth is weak and the stock is likely to be undervalued.
Thus, the P/E ratio is not just a number; it represents what the market believes about the company’s profitability potential.

P/E Ratio Formula and Calculation
Here’s how to calculate the P/E ratio.
PE Ratio Formula:
P/E Ratio = Price per Share ÷ Earnings per Share
Where;
Price per Share = Current market price of one share
EPS = Net Profit ÷ Number of Outstanding Shares
Example:
Suppose Company ABC has:
Current Share Price = ₹300
Earnings per Share (EPS) = ₹15
Then,
P/E Ratio = ₹300 ÷ ₹15 = 20
This means that investors are paying 20 ₹ for each 1 ₹ of earnings of ABC.
Types of P/E Ratios
1. Trailing P/E Ratio
This is a P/E ratio based on the prior 12 months’ earnings. It is indicative of the company's historical performance.
2. Forward P/E Ratio
This is a P/E ratio based on future earnings estimates. It is indicative of a company's future growth potential.
How to Interpret the P/E Ratio
A company's growth rate, state of the industry and state of the market all influence how you perceive a P/E ratio.
|
Condition |
Interpretation |
|
High P/E Ratio |
Future profits growth is anticipated by investors to be robust. But if the growth doesn't happen, the stock can be overpriced. |
|
Low P/E Ratio |
The stock might be undervalued or the company could be facing challenges. It may also indicate slow growth. |
|
Negative P/E Ratio |
The company has losses (negative earnings), so P/E ratio is not meaningful. |
Thus, it is best to compare P/E ratios to other companies within the same sector rather than across different sectors.
What is a Good P E Ratio?
Many investors ask, “What is a good P E ratio?”
Since it depends on the industry and the state of the market, there is no one-size-fits-all solution; nonetheless, some broad recommendations are as follows:
-
For Grown companies: P/E ratio of 10–20 is reasonable.
-
For growth companies: A P/E ratio of 25–40 or higher is often reasonable due to expectations of higher future earnings.
-
For cyclical Industries: The P/E ratio will vary largely due to economic conditions.
Example:
Higher expected growth potential is a common reason behind high P/E ratios for IT and consumer tech stocks.
Companies in the manufacturing or public sector units usually have a lower P/E ratio because their earnings grow more slowly.
When assessing a stock, a P/E ratio should be considered “good” when it meets the company's earnings growth or the industry growth.
P/E Ratio in Stock Analysis
The P/E ratio is one of the first calculations that investors must learn because it helps them:
1. Valuation Quickly
The P/E ratio permits a comparison of a company’s price and earnings, which is excellent for initial analyses.
2. Compare with Industry Peers
Compare the P/E ratio with industry peers to get a relative sense of a company’s valuation.
3. Market Sentiment
A high P/E ratio means optimism about the company’s future growth and profits, while a low P/E ratio shows caution.
4. Estimation of Future Returns
A lower P/E ratio with strong fundamentals growing to the industry average should be correlated.
Disadvantages of PE Ratio
Despite their popularity, PE ratios have certain flaws.
-
When a company's earnings are negative, the P/E ratio is useless and should be disregarded.
-
To improve comprehension, take into account the price-earnings ratio in addition to other metrics like the PEG ratio, Price-to-Book ratio, or EV/EBITDA.
P/E Ratio Across Industries
|
Sector |
Average P/E Ratio Range |
|
Banking & Finance |
10 – 18 |
|
IT & Technology |
25 – 40 |
|
FMCG |
30 – 50 |
|
Manufacturing |
10 – 20 |
|
Infrastructure |
8 – 15 |
Example: Market P/E for Unit
Consider the following companies, each of which has a P/E ratio of = 8 at an Annual/Monthly of 300 for the price.
|
Company |
Price (₹) |
EPS (₹) |
P/E Ratio |
|
Company A |
400 |
20 |
20 |
|
Company B |
400 |
10 |
40 |
Companies A and B have the same price of 400. However, Company B’s share is much more ‘expensive’ as investors are willing to pay 40 whereas the other is 20 for earnings of 1.
Company B’s price may still be worth purchasing if the growth with the earnings makes sense; otherwise, it is overvalued.
Key Takeaways
The P/E ratio formula is:
P/E = Price per Share ÷ Earnings per Share
It helps determine how expensive or cheap a stock is.
High P/E = growth expectation or overvaluation.
Low P/E = undervaluation or weak sentiment.

Conclusion
The P/E ratio is one of the simplest yet most powerful metrics available to investors. It shows a company's value and how the stock is perceived in the market. It is not appropriate to utilize it alone. A comprehensive picture is required, therefore always mix it with other measures like growth rate, debt, and return on equity (ROE).
Investors can make better decisions by distinguishing between high-quality and overhyped stocks by knowing what a decent P/E ratio is.
Traders frequently utilize other indicators to assess market emotion, even though the P/E ratio aids investors in understanding valuation. The Put Call Ratio (PCR), which assists in determining whether the general state of the market is bullish or bearish, is one such widely used statistic.
Learn how the Put Call Ratio functions and how to utilize it in conjunction with valuation indicators like P/E by reading our comprehensive tutorial.

DISCLAIMER: This blog is NOT any buy or sell recommendation. No investment or trading advice is given. The content is purely for educational and information purposes only. Always consult your eligible financial advisor for investment-related decisions.


