Home >> Blog >> Implied Volatility Explained: How IV Affects Option Prices
Implied Volatility Explained: How IV Affects Option Prices
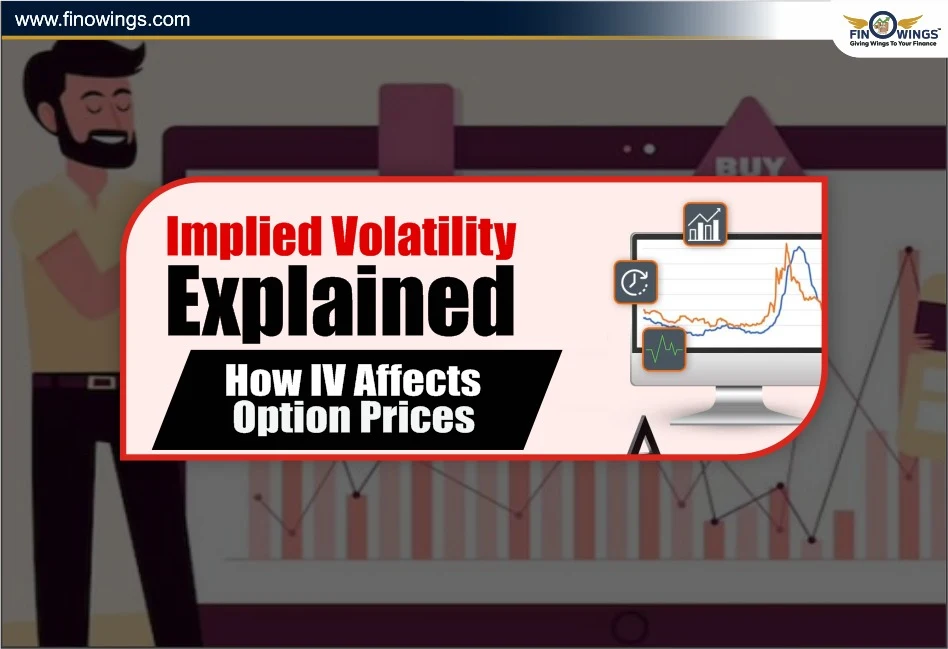
Table of Contents
- What is Implied Volatility (IV)
- How Is Implied Volatility Estimated?
- How Implied Volatility Determines Option Prices
- What is a Good Implied Volatility for Options?
- Understanding Implied Volatility (IV) In Options Trading
- Highest Implied Volatility Stocks And Why It Matters
- Implied Volatility and Historical Volatility
- Conclusion
If you have traded options and looked through an options chain, you have definitely heard of the term “implied volatility’ or IV”. It is one of the most important factors that determine option pricing, and also one of the most misunderstood. Knowing what implied volatility is and also how it affects your trades and pricing can provide a serious advantage in weighted options.
The goal of this article is to explain what IV is in options, explain its importance, how it affects pricing, and how you can avoid pitfalls in order to improve your trading.
What is Implied Volatility (IV)
Let’s keep it really simple. Implied Volatility is a measure of the market’s forecast of a likely movement in a given underlying asset’s price. It’s represented in a variety of time frames. It does not show the direction, just the magnitude of the predicted movement.
In options trading, implied volatility options means higher uncertainty. Market players expect higher IV to lead to greater price shifts.
Let’s look at an example;
If IV is high, it means price volatility is more likely, and traders expect larger shifts in price.
When IV is low, it may suggest traders expect low price movements and low uncertainty.
How Is Implied Volatility Estimated?
Implied Volatility is not a directly concrete figure and is back-calculated from the option’s market price using an options pricing model, for example, Black-Scholes.
In this example, when you look at an option price, a part of it reflects the market’s expectation of a future movement of the asset. The model uses that price to estimate what level of volatility traders are “assuming" and thus “implied volatility”.
In the case of historical volatility, it looks backward and focuses on past price changes, while implied volatility looks forward, encapsulating what the market thinks will happen in the future.
How Implied Volatility Determines Option Prices
Aspects of Implied Volatility directly influence option premiums. The option premium is the price an option holder pays or is paid for the option when they are trading it.
Here’s how it works in this table:
|
IV Level |
Market Sentiment |
Option Premium |
Explanation |
|
High IV |
High uncertainty |
Expensive |
Traders expect big moves; sellers demand higher premiums. |
|
Low IV |
Calm market |
Cheap |
Traders expect stability; premiums are lower. |
When IV rises, the price of a call and put option increases, even when the stock price does not change. The same is true in reverse; when IV falls, the price of the option decreases.
This is the reason why many professional traders state, "Volatility moves the market as much as the direction does."
What is a Good Implied Volatility for Options?
One of the most frequently asked questions by beginner traders is: "What is a good Implied Volatility for options?"
The answer depends on your strategy and the market outlook.
For Option Buyers: Lower IV is better because options will be cheaper for you. You want the IV to increase after you buy so that your option’s value appreciates.
For Option Sellers (Writers): You will prefer a higher IV because you will receive higher premiums on your options. You want the IV to decrease after you sell so that the option loses value quickly.
As a general rule of thumb:
-
IV between 15% - 25% is neutral.
-
IV over 30% - 40% means volatility is high, which comes with higher risk.
-
IV under 10% - 15% means the market is calm and low volatile.
Understanding Implied Volatility (IV) In Options Trading
So, what is IV in options and why does it entail that people follow it that closely?
IV shows how active the options market is. It assesses how people feel, how much risk they see, and how they project future changes. When there is a jump in IV, it is a sign that something has created a lot of speculation, attention, and/or market-moving news (like earnings, policies, and geopolitical news).
Here’s how IV changes common trading scenarios:
1. Before Earnings or Events: Traders foresee a large movement in the underlying stock’s price, which leads them to buy or sell the options, which, in turn, leads to the price of options getting even more expensive.
2. After Earnings: This is when the “IV crush” occurs as uncertainty has disappeared. Even if the stock makes a slight movement, the option prices drop sharply.
3. During Market Stress: IV of all stocks simultaneously increases. This is common during market crashes, wars, and other policies that affect most people.
Recognising implied volatility options behaviour in these situations allows traders to have more accurate entries and exits.
Highest Implied Volatility Stocks And Why It Matters
Traders looking for stocks with the highest implied volatility tend to do so in the hopes for potentially larger gains - but of course, it comes with larger risk. Volatility tends to be high in the technology, biotechnology, and small-cap growth stocks sectors due to the occurrence of high-impact news and rapid price changes. The same is true, for instance, of large-cap equity indices during high uncertainty periods, such as elections and interest rate decisions.
That said, trading options on assets with the highest implied volatility requires a great deal of self-control. While the volatility premiums are enticing, the price movement may be disorderly.
Implied Volatility and Historical Volatility
One must differentiate between implied and historical volatility in order to truly understand volatility. The discrepancies are summarized in the following table:
|
Type |
Based On |
Represents |
Used For |
|
Implied Volatility |
Current option prices |
Expected future movement |
Forecasting & strategy decisions |
|
Historical Volatility |
Past price data |
Actual past movement |
Analyzing past risk/trend strength |
When implied volatility exceeds historical volatility, the market may be pricing in uncertainty or a high-impact event, which could present an opportunity for option sellers.
Using the Implied Volatility in Practice
1. Monitor IV Rank and IV Percentile: Used to measure the current IV as compared to its historical range is useful for entry point timing.
2. Buy Low IV and Sell High IV: This is one of the golden rules of options trading. It helps improve your odds and manage risk effectively.
3. IV Crush: Be especially careful when evaluating overpriced options near a high-impact news event. Expect large movements, or do not buy at all.
4. Spread Your IV Levels: Make sure not to allocate all your funds to high-IV trades and try to incorporate lower IV trades as well.
Conclusion
Summing all this information together, implied volatility acts as a powerful unseen force behind the trade option prices. It gauges the market expectations magnitude, not the direction, of future movements. By learning what implied volatility is, how it impacts the prices of options and what a good implied volatility is for options gives you have a better chance at strategically placing your trades. This is true whether you are buying calls, selling puts, or trying to hedge your funds.
Don’t forget: “In options trading, volatility is opportunity - but only for those who understand it.” Thus, when you analyse your options, use the IV and determine the market expectations.
Check out our comprehensive article on Top 10 Passive Income Ideas in India if you're interested in creating a reliable source of income outside of trading. It covers clever, low-risk strategies to make your money work for you even when the markets are closed.
Author
Frequently Asked Questions
Implied Volatility (IV) represents the market’s forecast of the expected movement in an asset’s price. It shows how volatile traders believe the market will be but does not indicate direction.
When IV rises, both call and put option premiums become more expensive. Conversely, when IV drops, option prices fall, even if the stock price remains unchanged.
Typically, IV between 15%–25% is neutral. IV above 30%–40% indicates higher risk and potential reward, while IV below 10%–15% reflects a calm, stable market.
An IV crush occurs after major events like earnings announcements. Once uncertainty fades, implied volatility falls sharply, causing option prices to drop even if the stock moves slightly.
Implied volatility predicts future price movement based on current option prices, while historical volatility measures past price fluctuations using actual data.

