
Bollinger Bands are among the most dependable techniques available for technical analysis. Understanding how to read Bollinger Bands can really improve your market decisions. Whether you’re a beginner looking to identify trends or a seasoned trader attempting to refine your market entry and exit strategies, the insights Bollinger Bands provide can enhance your trading decisions.
This blog aims to give you a solid grasp of Bollinger Bands and the basic strategies most people use to maximise their effectiveness.
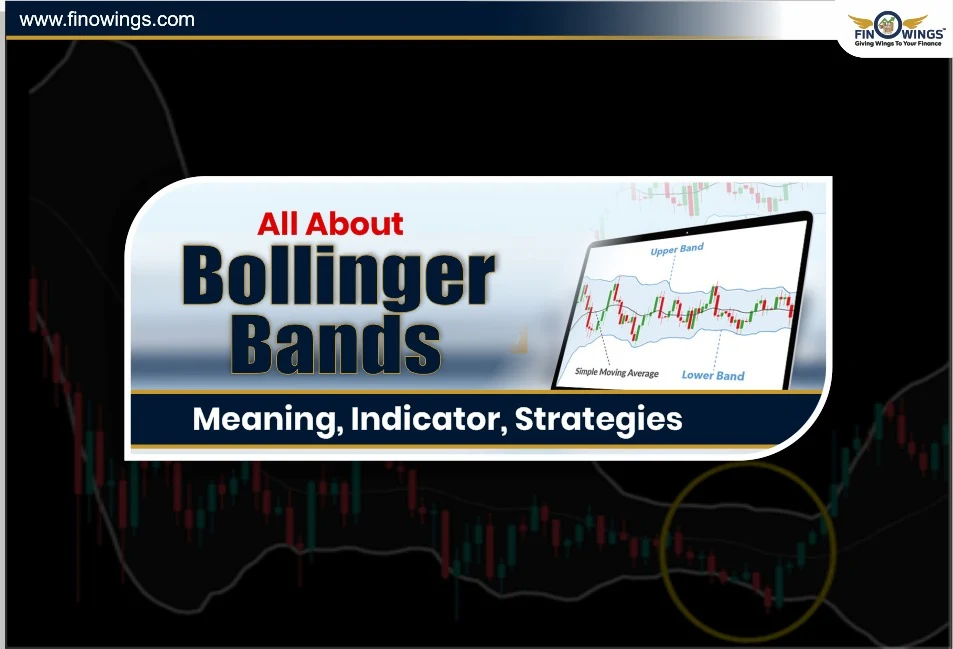
What are Bollinger Bands?
Bollinger Bands are just three lines on a price chart that are positioned using various calculations.
1. Middle band - a 20-day simple moving average of the price.
2. Upper band - the standard moving average value plus two standard deviations.
3. Lower band - the standard moving average value minus two standard deviations.
When the price chart bands expand or retract, it is a reflection of market volatility. If the market volatility is high, the bands expand. If market volatility is low, the bands retract. Bollinger Bands show the market volatility and possible reversal trading zones and help provide the “snap-back” probabilities to the average price.

How the Bollinger Bands Indicator Works
The Bollinger Bands indicator is based on a simple idea - the price will “bounce” and “swing” between the upper and lower bands and back to the average.
-
When the price is touching and/or going above the upper band, the value is probably overbought, and a pullback reversal is possible.
-
When the price is touching and/or going below the lower band, the value is probably oversold and the price is a likely buying opportunity.
-
When the bands come close together, this is a period of low volatility - this is usually followed by a strong breakout or trend continuation.
Bollinger Bands are a useful tool for the all-in-one trader because they help assess price momentum, volatility, and trend strength.
Bollinger Bands Explained with Example
Let’s say stock XYZ Ltd.’s price is Rs. 100. The 20-day SMA is Rs. 100 and the standard deviation is Rs. 5.
Upper Band = 100 + (2 × 5) = Rs. 110
Lower Band = 100 - (2 × 5) = Rs. 90
When the stock price reaches Rs. 110 or higher, it is in the overbought zone. Always be cautious of a short-term price decline. On the other hand, when the stock price is closer to Rs. 90, it is in the oversold zone, indicating a price increase is possible.
Traders use Bollinger Bands with other indicators such as volume, candlestick patterns, or momentum oscillators (RSI) to confirm signals and prevent traders from taking losing positions.
Top Bollinger Bands Strategies
Now that you understand how the indicator works, let’s explore some of the best Bollinger Band strategies traders use to make profitable decisions.
1. The Bollinger Band Squeeze Strategy
When the upper and lower bands come near each other and make a "squeeze", it indicates low volatility. This low volatility almost always indicates a significant price change is likely to occur.
How to trade it:
Look for a squeeze followed by a breakout in any direction.
Enter the trade once the price closes outside of the band and there is significant volume.
Your stop-loss should be just inside the band. Place it on the opposite side of the breakout.
Why does this strategy work? Because sharp breakouts tend to happen after prolonged periods of low volatility, this approach helps identify those breakouts.
2. The Bollinger Band Reversal Strategy
This strategy helps identify potential reversal points by spotting overbought and oversold conditions.
Trading this strategy involves:
-
When the price reaches the top band, look for bearish reversal candlestick patterns, like shooting stars or dojis, to short the asset.
-
To take a long position when the price hits the bottom band, look for bullish reversal candlestick patterns, such as hammers or bullish engulfing patterns.
Pro tip: Use RSI or MACD alongside this strategy to ensure a momentum reversal.
This Bollinger Bands strategy is best when the market is sideways.
3. The Double Bottom and Top Strategy
Double Bottom: It is considered a bullish indication if the price meets and retreats from the lower band twice.
Double Top: Bearish pressure is evident if the price touches the upper band twice without breaking.
The middle band (SMA) is often used by traders as a reversal confirmation.
4. The Trend-Following Bollinger Bands Strategy
Bollinger Bands are great at helping traders stay in trends without getting stopped out due to volatility in the market.
How to trade it:
-
In an uptrend, prices tend to “walk the upper band.” Keep the long position until there is a candle that closes below the middle band
-
In a downtrend, prices tend to “hug the lower band.” Keep the short position until there is a candle that closes above the middle band.
This is the best Bollinger Bands strategy since it helps traders ride trends using the bands as dynamic stop-loss or trailing levels.
Common Mistakes When Using Bollinger Bands
Although powerful, the Bollinger Bands indicator can also provide false or misleading signals.
1. Not having a sufficient volume or momentum indicator to confirm the entry.
2. Assuming that every band touch means a reversal. In some cases, prices can trend along the band for a long time, leading to a false reversal.
3. The greater market context is important. Bollinger Bands are best used with other indicators like moving averages or RSI.
Bollinger Bands should always be used with other techniques to confirm the signals.
Advantages of Using Bollinger Bands
-
They are effective for determining volatility and identifying market reversals.
-
They can be used in every time period, whether intraday, swing, or positional. Helps to set dynamic stop-loss and profit targets.
-
Useful for both range trading and trend following.
Learn how experts use Bollinger Bands in conjunction with derivative methods to maximize profits by reading our comprehensive guide, Complete Guide to Options and Futures Trading in India.

Final Thoughts
Bollinger Bands are among the most flexible tools available in technical analysis. They automatically adapt to various market conditions and serve as a visual display of volatility and momentum, along with possible price turning points.
Your trading style will determine the best Bollinger Band strategy. For example, swing traders can take advantage of reversals and trend confirmations, while breakout traders will profit using the squeeze strategy. By combining this indicator with effective risk management, you will significantly improve the precision of your entry and exit timing.

DISCLAIMER: This blog is NOT any buy or sell recommendation. No investment or trading advice is given. The content is purely for educational and information purposes only. Always consult your eligible financial advisor for investment-related decisions.


