Home >> Blog >> How to Use Moving Averages(MA) for Smarter Stock Trading
How to Use Moving Averages(MA) for Smarter Stock Trading
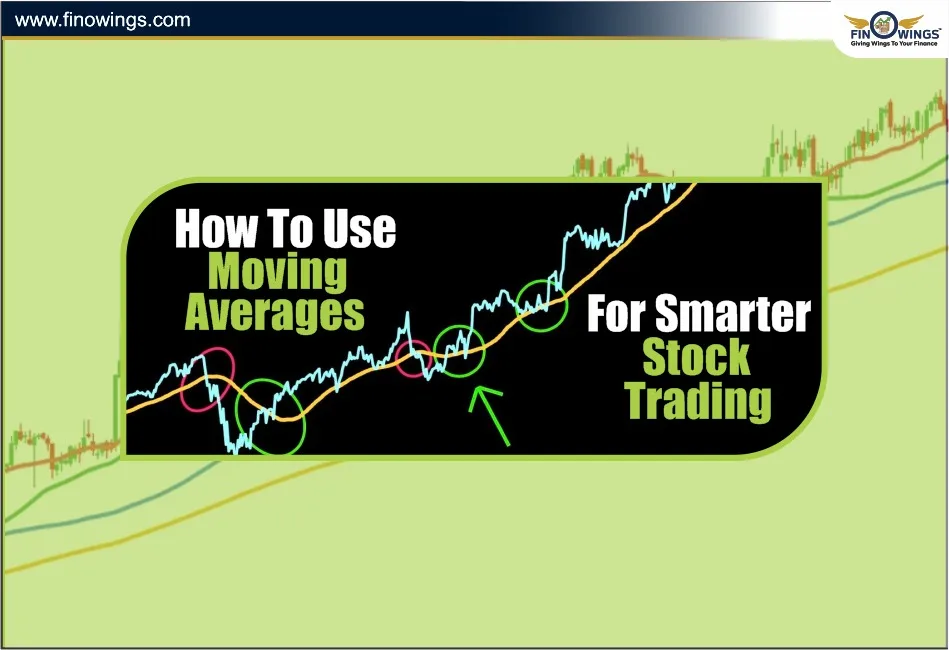
Table of Contents
- What is a Moving Average
- Why Moving Average Stocks Are So Common?
- Identifying Trends Using Moving Averages
- 1. Single Moving Average Strategy
- 2. Dual Moving Average Crossover Strategy
- 3. Dynamic Support & Resistance Strategy
- 4. Multi Time Frame Moving Average Strategy
- 5. Best Timeframes for Using Moving Averages
- Moving Average Common Beginner Mistakes
- Avoid Using Moving Averages During
- Final Thoughts
Trading stocks is notably less difficult once you can see and understand how trends move. Knowing how reversals occur and where momentum changes can make or break a trading strategy. Moving averages are one of the most powerful tools in technical analysis to easily show you these trend changes. Regardless of whether you are a day trader or a long-term trader, a moving average can help you make better decisions and higher-quality trades.
Moving Averages is this specific guide's primary focus, along with how to identify trends using them, which stocks to apply moving averages to, and value offering multiple Trading Moving Averages strategies.
What is a Moving Average
A Moving Average (MA) is a type of Technical indicator that helps to smooth out price data over a certain duration of time. Instead of reacting to sharp price movements, it helps by giving a clearer trend over time.
Some different types of moving averages are:
- Simple Moving Average (SMA).
-
Average price over a specific time.
-
Exponential Moving Average (EMA).
-
Reacts more quickly to price movements and gives more weight to recent price changes.
-
For what it's worth, moving averages assist in determining if a particular stock is trending in a positive direction, a negative direction, or just going sideways.
Why Moving Average Stocks Are So Common?
Stocks tend to follow a moving average, and when they do, they are called Moving Average Stocks. These stocks tend to follow the support and resistance levels of their moving averages, which are often set to:
-
20-day EMA.
-
50-day SMA.
-
100-day SMA.
-
200-day SMA.
These stocks are preferred by most professional traders because of the following:
-
Trends are easier to follow.
-
Prices tend to stay around the key levels.
-
Trend predictions are more accurate.
-
For these reasons, moving averages are one of the most popular stock indicators.
Identifying Trends Using Moving Averages
A. Up Trend
-
Price is above the moving average.
-
The moving average line is sloping upward.
-
Higher highs and higher lows are consistently being formed.
B. Downtrend
-
Price remains below the moving average.
-
The moving average shows a downward slope.
-
Identifiable lower highs and lower lows.
C. Sideways Trend
-
The price hovers around the moving average.
-
The moving average remains flat.
-
A lack of obvious highs and lows.
Technical Analysis Moving Average Strategies
Moving averages are used in a lot of trading methods nowadays. Some are especially helpful and suitable for beginners:
1. Single Moving Average Strategy
For this strategy, you will use a single moving average. For example, you could use a 50 SMA:
Buy Signal: Price breaks above the moving average
Sell Signal: Price breaks below the moving average
This method is a great way to follow the trend while keeping things simple.
2. Dual Moving Average Crossover Strategy
This method is popular among users of technical analysis, Moving Average trading.
Use two Moving Averages:
Fast Moving Average (Short term): 10 or 20 EMA.
Slow Moving Average (Long term): 50 or 200 SMA.
Buy Signal: Fast Moving Average crosses above Slow Moving Average (Golden Cross).
Sell Signal: Fast Moving Average crosses below Slow Moving Average (Death Cross).
This strategy works best for positional and swing traders.
3. Dynamic Support & Resistance Strategy
Moving averages often act as invisible support and resistance lines.
In uptrends: 20 EMA → Dynamic Support
In downtrends: 20 EMA → Dynamic Resistance
4. Multi Time Frame Moving Average Strategy
Check moving averages on the:
-
Daily Chart
-
Hourly Chart
-
15 Minute Chart
If the moving average trend direction matches on all time frames, the trade becomes a high-confidence trade.
5. Best Timeframes for Using Moving Averages
Depending on your style:
Scalping / Intraday Traders:
9 EMA
20 EMA
50 EMA
Swing Traders:
20 SMA
50 SMA
100 SMA
Long Term Investors:
100 SMA
200 SMA
Stocks that respect these levels are considered powerful moving average stocks.
Moving Average Common Beginner Mistakes
Here are some moving averages common mistakes that should be avoided:
-
Using too many moving averages at once.
-
Trading into every crossover without analysing the preceding market condition.
-
Neglecting volume and market trend.
-
Not considering support or resistance zones.
-
Using smaller timeframes in highly unstable markets.
-
Getting into the trade too early when the price moves above the moving average line.
-
Using moving averages requires a more disciplined approach.
Avoid Using Moving Averages During
Keep the following situations in mind:
-
One-sided, highly volatile markets are always dangerous and Moving Averages have a hard time in these situations.
-
Sharply trending markets that are driven by news and sudden movements are another time you might not want to use Moving Averages.
-
Markets that are trending sideways, that are not moving much in either direction.
-
Always be cautious when using these strategies on thinly traded stocks.
-
These are the conditions that the strategies based on using Moving Averages.
Final Thoughts
There is no doubt that Moving Averages are an incredibly useful tool in your technical analysis of the markets. They provide a lot of help while trying to find an overall trend direction and looking for places to buy and sell. Knowing how to use Moving Averages properly and effectively will allow you to make more constructive and logical choices in the markets.
Consistency is key, whether you are learning more Moving Average technical analysis strategies, looking for moving average stocks, or using moving average trading strategies. No Moving Average strategy is going to be perfect and always provide you with guaranteed profits, but you will be much more likely to succeed in the markets and trading when you have a good Moving Average strategy as part of your trading systems.
DISCLAIMER: This blog is NOT any buy or sell recommendation. No investment or trading advice is given. The content is purely for educational and information purposes only. Always consult your eligible financial advisor for investment-related decisions.
Author
Frequently Asked Questions
The best moving average depends on your trading style. Intraday traders prefer fast EMAs like the 9 EMA or 20 EMA, while swing traders use the 50 SMA or 100 SMA. Long-term investors rely on the 200 SMA to identify major trend direction.
Moving averages smooth out price action to show whether a stock is in an uptrend, downtrend, or sideways phase. When the price stays above the MA, the trend is bullish; when it stays below, it is bearish. A flat MA indicates a range-bound market.
A moving average crossover strategy uses two MAs: a fast one and a slow one. A Golden Cross occurs when the fast MA crosses above the slow MA, signaling a buy. A Death Cross happens when the fast crosses below the slow, signaling a sell.
For intraday trading, short timeframes like 5-minute, 15-minute, and hourly charts work well with EMAs. Swing traders prefer daily charts using the 20, 50, or 100 SMA. Long-term investors analyze weekly or monthly charts with the 200 SMA.
Traders should avoid moving averages during highly volatile markets, news-driven spikes, sideways ranges, or thinly traded stocks. In such conditions, moving averages lag and may give false signals.


.webp)
