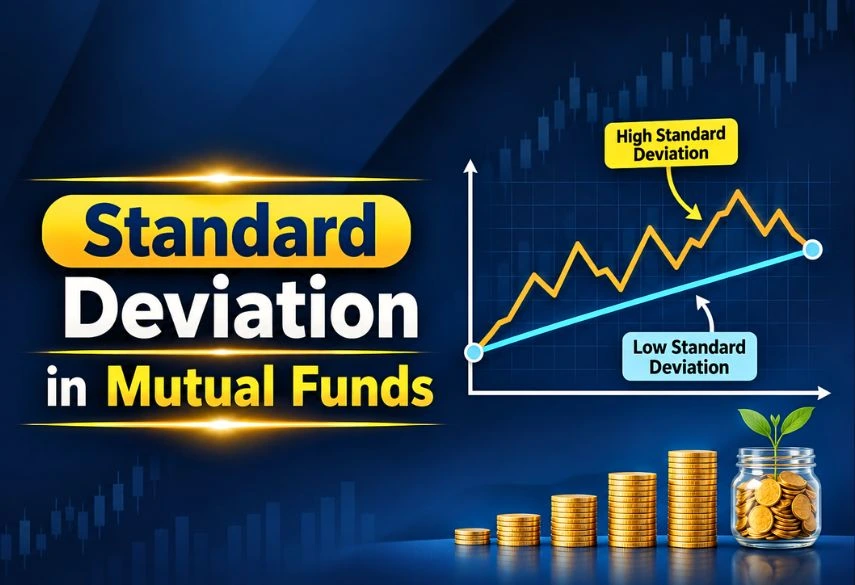
Standard deviation in mutual funds is a simple statistical number that shows how much a fund’s returns bounce around its average return. In plain words, it measures volatility in mutual funds - the ups and downs an investor actually experiences. A higher number means bigger swings and higher risk; a lower number means steadier performance. This single metric is one of the most useful mutual fund risk measures available to everyday investors.
Understanding Standard Deviation Mutual Fund Meaning
When people ask “what is standard deviation in mutual funds,” they are really asking how risky or bumpy the journey might be. Returns alone do not tell the full story. Two funds can both deliver 12% average annual returns, yet one may feel calm while the other feels like a roller-coaster. Mutual fund standard deviation captures that difference.
Think of it like the weather. The average temperature in a city may be 25°C, but if the temperature swings between 10°C and 40°C every week, living there feels very different from a place where it stays between 22°C and 28°C. Standard deviation is the financial version of that temperature range.
It is calculated from the fund’s past monthly or yearly returns and is usually shown as an annualised percentage. Most platforms display the three-year or five-year mutual fund standard deviation so investors can compare funds easily.
Why Standard Deviation Matters for Investors
Knowing the standard deviation mutual fund meaning helps you match investments to your comfort level. If you get nervous when markets fall 10–15% in a few months, you will prefer low standard deviation mutual funds. If you can stay invested through sharp ups and downs in search of higher long-term growth, high standard deviation mutual funds may suit you better.
It is also one of the core ways of how to measure risk in mutual funds. While the SEBI mutual fund riskometer gives a broad category (low, moderate, high, very high), standard deviation gives a precise number that can be compared across funds in the same category.

How to Calculate Standard Deviation in Mutual Fund
You do not need to calculate it yourself every time - most mutual fund websites and apps already show the number. Still, understanding the process makes the metric clearer.
The standard deviation formula mutual fund uses is:

Where:
- Ri = each individual return
- R = average (mean) return
- N = number of observations
Example
Suppose a fund delivered these annual returns over five years: 8%, 14%, 6%, 12%, and 10%.
1. Average return = (8+14+6+12+10)/5 = 10%
2. Differences from average: –2, +4, –4, +2, 0
3. Square the differences: 4, 16, 16, 4, 0
4. Average of squared differences (using N–1) ≈ 10
5. Square root ≈ 3.16%
So the fund’s standard deviation is roughly 3.2%. This means that in most years the return stayed fairly close to the 10% average.
In practice, fund houses use monthly returns over three or five years and then annualise the figure. The calculation is the same; only the data frequency changes.
High Standard Deviation Mutual Funds vs Low Standard Deviation Mutual Funds
Low standard deviation mutual funds
These funds keep returns close to their average. Debt funds, liquid funds, and many large-cap or conservative hybrid funds usually fall here. The ride feels smoother, and the chance of large short-term losses is lower. Suitable for investors who need money in the medium term or who dislike volatility.
High standard deviation mutual funds
These funds show wide swings. Small-cap, mid-cap, sectoral, and thematic funds typically have higher numbers. They can deliver strong gains in rising markets but can also fall sharply. Suitable for long-term investors with higher risk tolerance who can stay invested for seven to ten years or more.
Neither is automatically better. The right choice depends on your goals, time horizon, and ability to handle temporary losses.
Typical Standard Deviation Ranges by Category
|
Fund Category |
Typical Annualised SD Range |
Volatility Level |
|
Liquid / Overnight Funds |
0.1% – 0.5% |
Extremely Low |
|
Short-duration Debt Funds |
1% – 3% |
Low |
|
Corporate Bond / Banking |
2% – 4% |
Low to Moderate |
|
12% – 16% |
Moderate |
|
|
Flexi-cap / Multi-cap |
13% – 18% |
Moderate to High |
|
17% – 23% |
High |
|
|
18% – 28% |
High to Very High |
|
|
Sectoral / Thematic |
20% – 30%+ |
Very High |
These ranges are approximate and change with market conditions. Always compare a fund with its category peers rather than looking at the number in isolation.
Standard Deviation vs Beta and Other Risk Metrics
Many investors get confused between different mutual fund risk measures. Here is a clear comparison.
Standard deviation vs beta
-
Standard deviation measures the fund’s total volatility - both market-related and fund-specific.
-
Beta measures only how much the fund moves relative to the market (usually Nifty 50 or similar).
A fund can have high standard deviation even if its beta is close to 1, because of stock-selection risk. Conversely, a fund with beta of 1.2 can still have moderate standard deviation if its stocks move in a relatively controlled way. Looking at both numbers together gives a fuller picture.
Alpha, beta, standard deviation mutual fund
Alpha shows excess return over the benchmark after adjusting for risk. When you combine alpha with standard deviation and beta, you can judge whether the extra return was worth the extra volatility the fund took.
Sharpe ratio and standard deviation
Sharpe ratio = (Fund return – Risk-free rate) / Standard deviation.
It directly uses standard deviation in the denominator. A higher Sharpe ratio means the fund delivered better risk-adjusted returns than mutual funds. Two funds with the same return but different standard deviations will have different Sharpe ratios the lower-volatility fund wins on a risk-adjusted basis.
How Investors Should Use Standard Deviation in Practice
1. Compare within the same category- never compare a small-cap fund’s SD with a large-cap fund’s SD.
2. Look at consistency- Prefer funds that have maintained reasonable SD over multiple market cycles.
3. Combine with other metrics- Check SD together with Sharpe ratio, maximum drawdown, and rolling returns.
4. Match to your time horizon- A longer horizon allows higher SD; a shorter horizon needs lower SD.
5. Review periodically- A fund’s standard deviation can rise or fall when the manager changes style or market conditions shift.
Conclusion
Standard deviation in mutual funds is one of the simplest yet most powerful tools available to investors. It answers a basic question: how bumpy will the ride be? By understanding what is standard deviation in mutual funds, how to calculate it, and how it compares with beta and Sharpe ratio, you move from guessing to informed decision-making.
Use it as part of a broader toolkit - not the only number you look at and you will choose funds that better match your goals and temperament. In the long run, staying invested through the volatility is often more important than chasing the highest returns.
(Sources: Motilal Oswal, SBI Mutual Fund,Scripbox,Angel One)

DISCLAIMER: This blog is NOT any buy or sell recommendation. No investment or trading advice is given. The content is only for educational purposes. Always discuss with your SEBI-registered financial advisor for investment-related decisions.
Follow this WhatsApp Channel for the latest updates directly on WhatsApp.